


When you read about the Internet of Things, you often hear about connected cars, connected kitchen appliances, small devices that let you order things quickly, or other consumer-grade applications. In this post, I will quickly describe a recent IoT project I worked on where the devices are not small consumer-grade sensors…they are large industrial manufacturing machines.
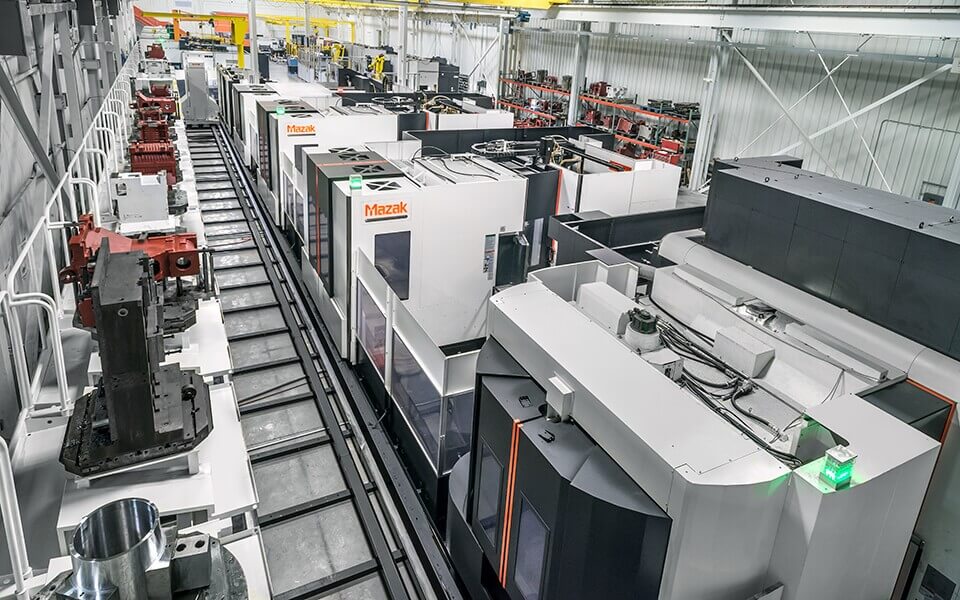
In this case, machines arranged on a shop floor are responsible for cutting metal into various shapes. These machines must be both very powerful and very precise, and they have robotic arms that are programmed to grip specialized tools for this activity. These machines use the MT Connect protocol as the language for communicating their operational status and the results of any action taken. On collection, the data is streamed to a collection point for analysis. In older machines, adapters are installed to stream the machine’s data using the common language.
Our work on this project helped the engineers identify optimal cut times by analyzing the machine activity data. First, we needed to enhance the collection process so that all data was readily available, then apply the appropriate business rules to identify cut time, and finally provide quick, actionable feedback on the outcome.To accomplish this, a few components were needed. First, a small application was deployed to a server in the factory floor. This application server acts as a field gateway to collect and aggregate all of the data from all the machines on the floor. The field gateway application implements the MT Connect protocol to allow communication from the machines and to interpret this data for downstream consumption.
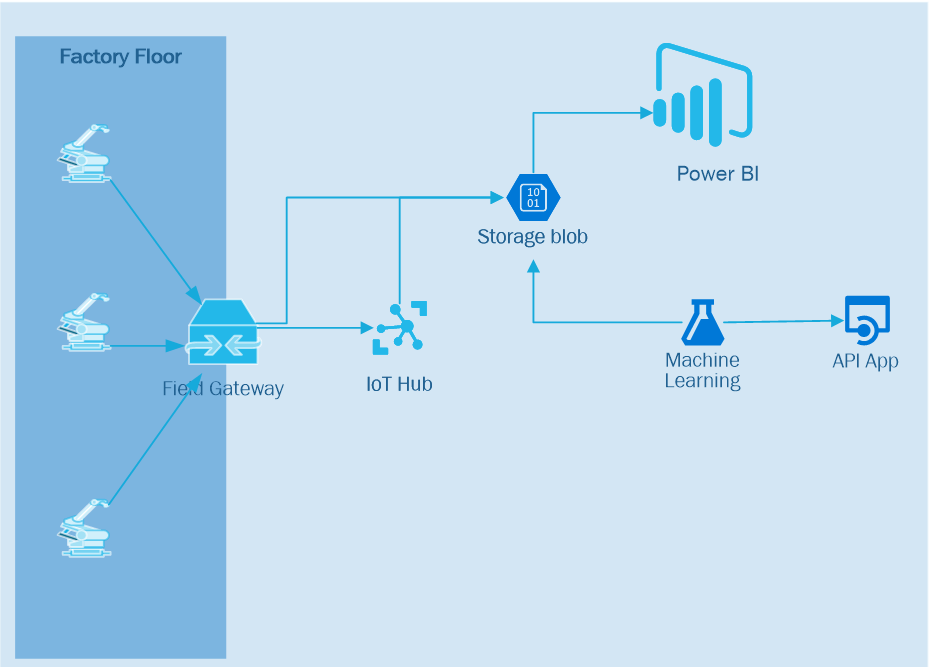
In addition to collecting and translating data from the machines themselves, the gateway application established connectivity to the second major component – the backend processing system. This system is made up of a collection of services readily available on the Microsoft Azure platform and includes an Azure IoT hub, Azure Storage Accounts, Azure Machine Learning, and Microsoft PowerBI for visualization. Before collection by the gateway application starts, the application sends a registration request for each machine to a backend processing system (see diagram below).
The backend processing system registers each device to Microsoft Azure’s IoT Hub, creates an Azure blob storage container per machine, and provides the connection string back to the gateway application. The field gateway application then begins streaming the data to the appropriate blob storage container. A few notes:
In typical IoT scenarios, the sensors themselves or the field gateway could send the data directly to the IoT Hub which would then forward the data on to storage or through a real-time processing engine (Azure Stream Analytics). However, in this case, the data collected from these machines can quickly reach a significant size – and often go beyond the size limit of individual IoT Hub messages (256K). So, in this case, the hub acts as a mechanism for registering the machine and creating the container and communicating this storage location per machine back to the gateway.
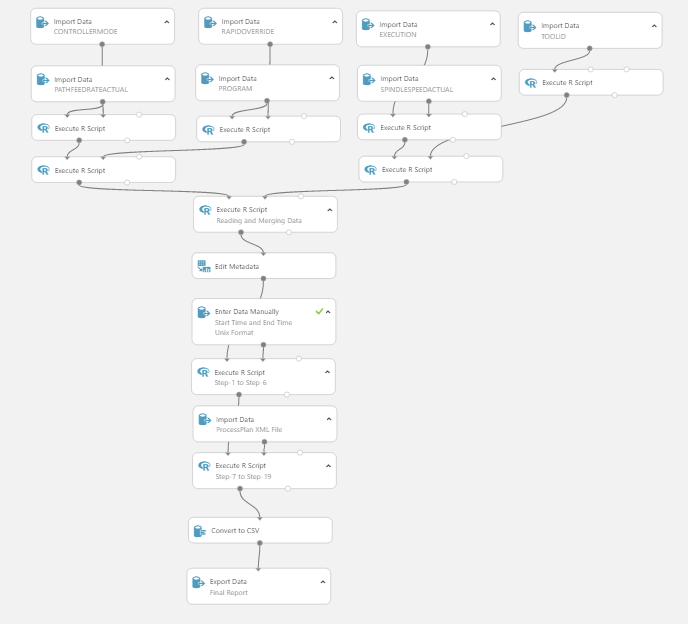
For the application of business rules, Azure Machine Learning was configured to read the raw data from the blob storage for each device. The ML experiment used follows the following workflow:
- Calculates the status of the machine
- Identifies the tools used during cutting
- Calculates the feed rate, and spindle speed
- Calculates the time spent cutting idle time.
The screenshot below shows the flow of activity in the ML experiment; from reading the raw data in blob storage to the application of the rules to posting the processed message back to a blob storage container for consumption.
A continually updated visualization of the data flowing through the system is then surfaced using Power BI:
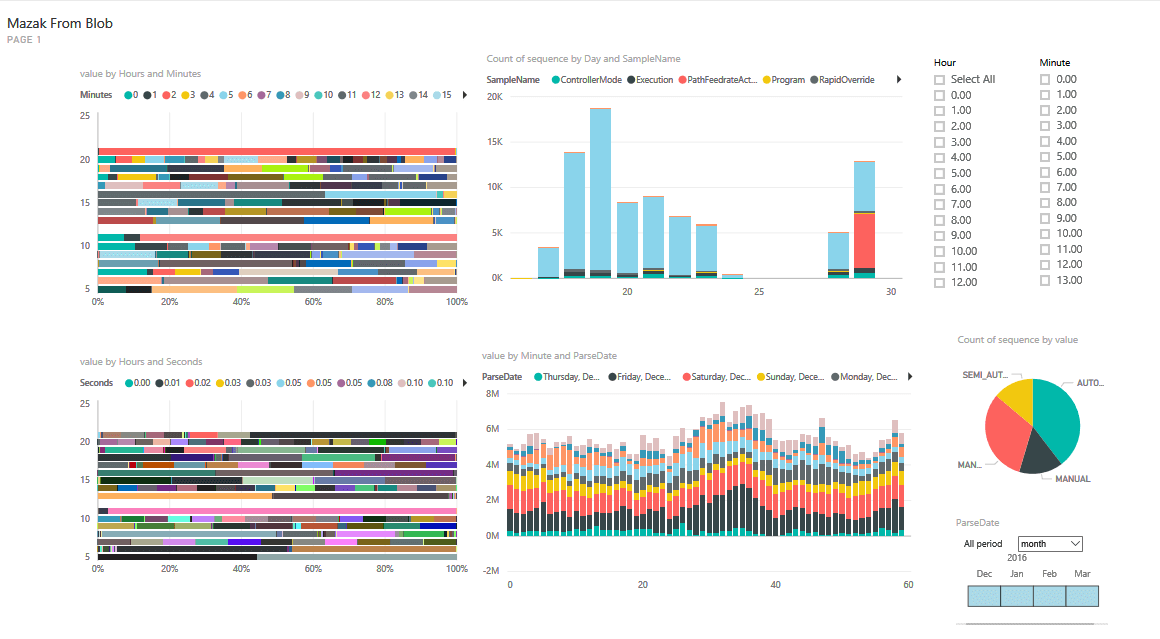
The Azure platform and its IoT capabilities not only allowed engineers to identify the actual cut times, but it also enabled them to provide recommendations for the type and sequence of tools to use for specific jobs. The Power BI dashboard is used to show the plan vs. actual cut time, and surface inefficiencies in the machine activity itself.