


Now available as a Visual Studio Code extension, Microsoft Edge Developer Tools lets you inspect network activity, view layout, and styling changes, and see runtime HTML, all without leaving VS Code. What prompted the Microsoft Edge Team to develop these tools? In their words:
Continuously switching between editor and browser adds cognitive load to your workflow throughout the day. You change from one environment to another – from development to debugging mode – and you need to switch back. That feedback is what prompted us to explore embedding the developer tools into an extension, thus allowing you to see what your code generates and debug it without leaving your “development” mindset. – Microsoft Blog
Do you want to take the leap and leave your traditional browser behind for good? Here are a few simple steps to help you get started with Microsoft Edge Developer Tools.
Step 1: Install the Microsoft Edge Browser
If you don’t already have the Microsoft Edge browser installed, you will need to install it. You can download the latest version here: Microsoft Edge.
Step 2: Install the Microsoft Edge Tools Extension
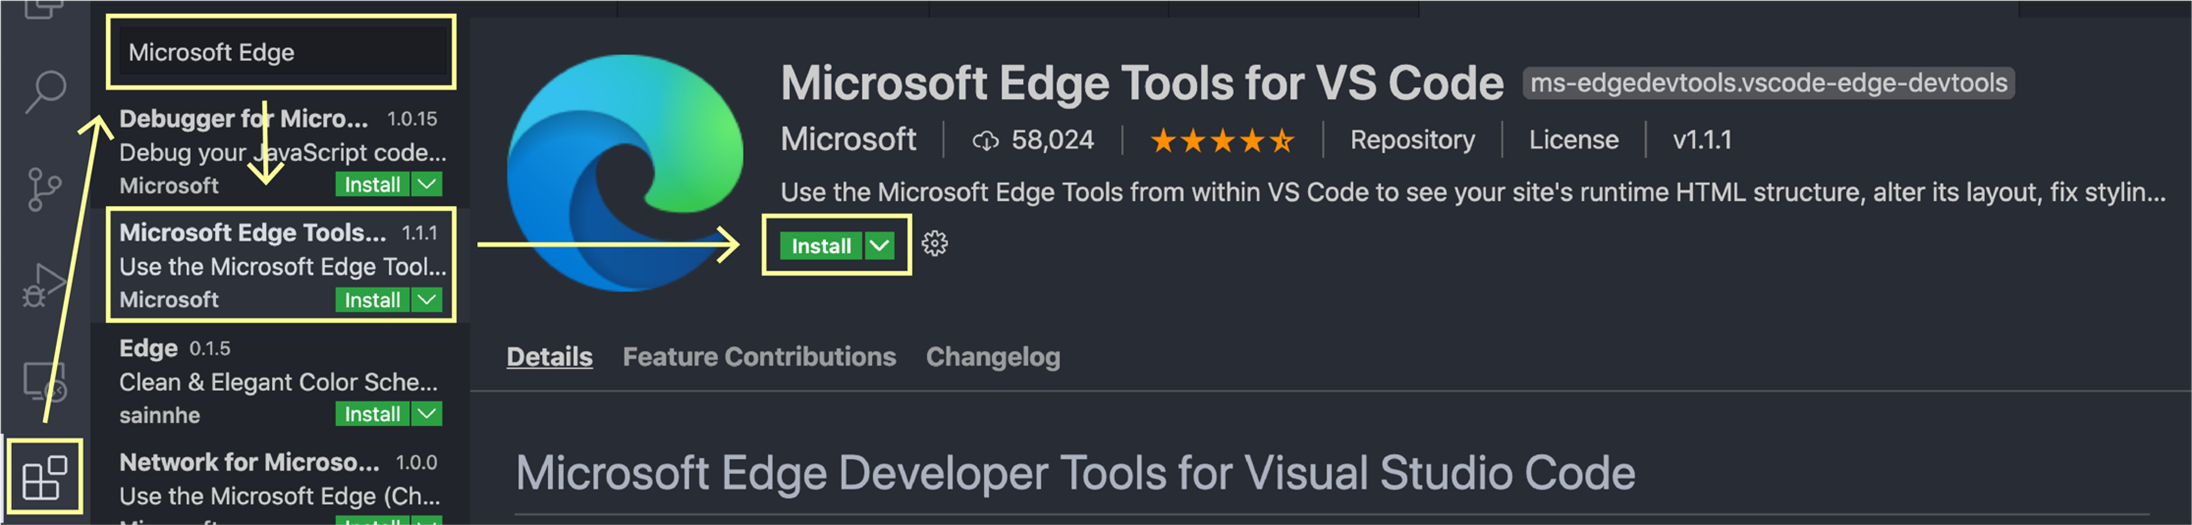
Open Visual Studio code and click on the extension’s icon on the left to load the extensions view.
Enter “Microsoft Edge” in the search box at the top, then click on “Microsoft Edge Tools…” to pull up the “Microsoft Edge Tools for VS Code” extension in the main window. Click “Install” to install the extension.
Step 3: Choose Full-browser or Headless Mode and Enable the Network Panel
- Full-browser Mode
You can operate MS Edge Tools in two different modes, full-browser or headless. If you work it in full-browser mode, which is the default mode, the extension will launch a new browser window to view your web application, which will automatically update when you make changes to your code. It will also create a smaller, mirrored browser window within VS Code that you may close if you wish, although you will lose the power and functionality of having your browser window right next to your HTML. Full-browser mode is a good choice if your screen is small or wants to view your app at full screen. To use full-browser mode, do nothing. - Headless Mode
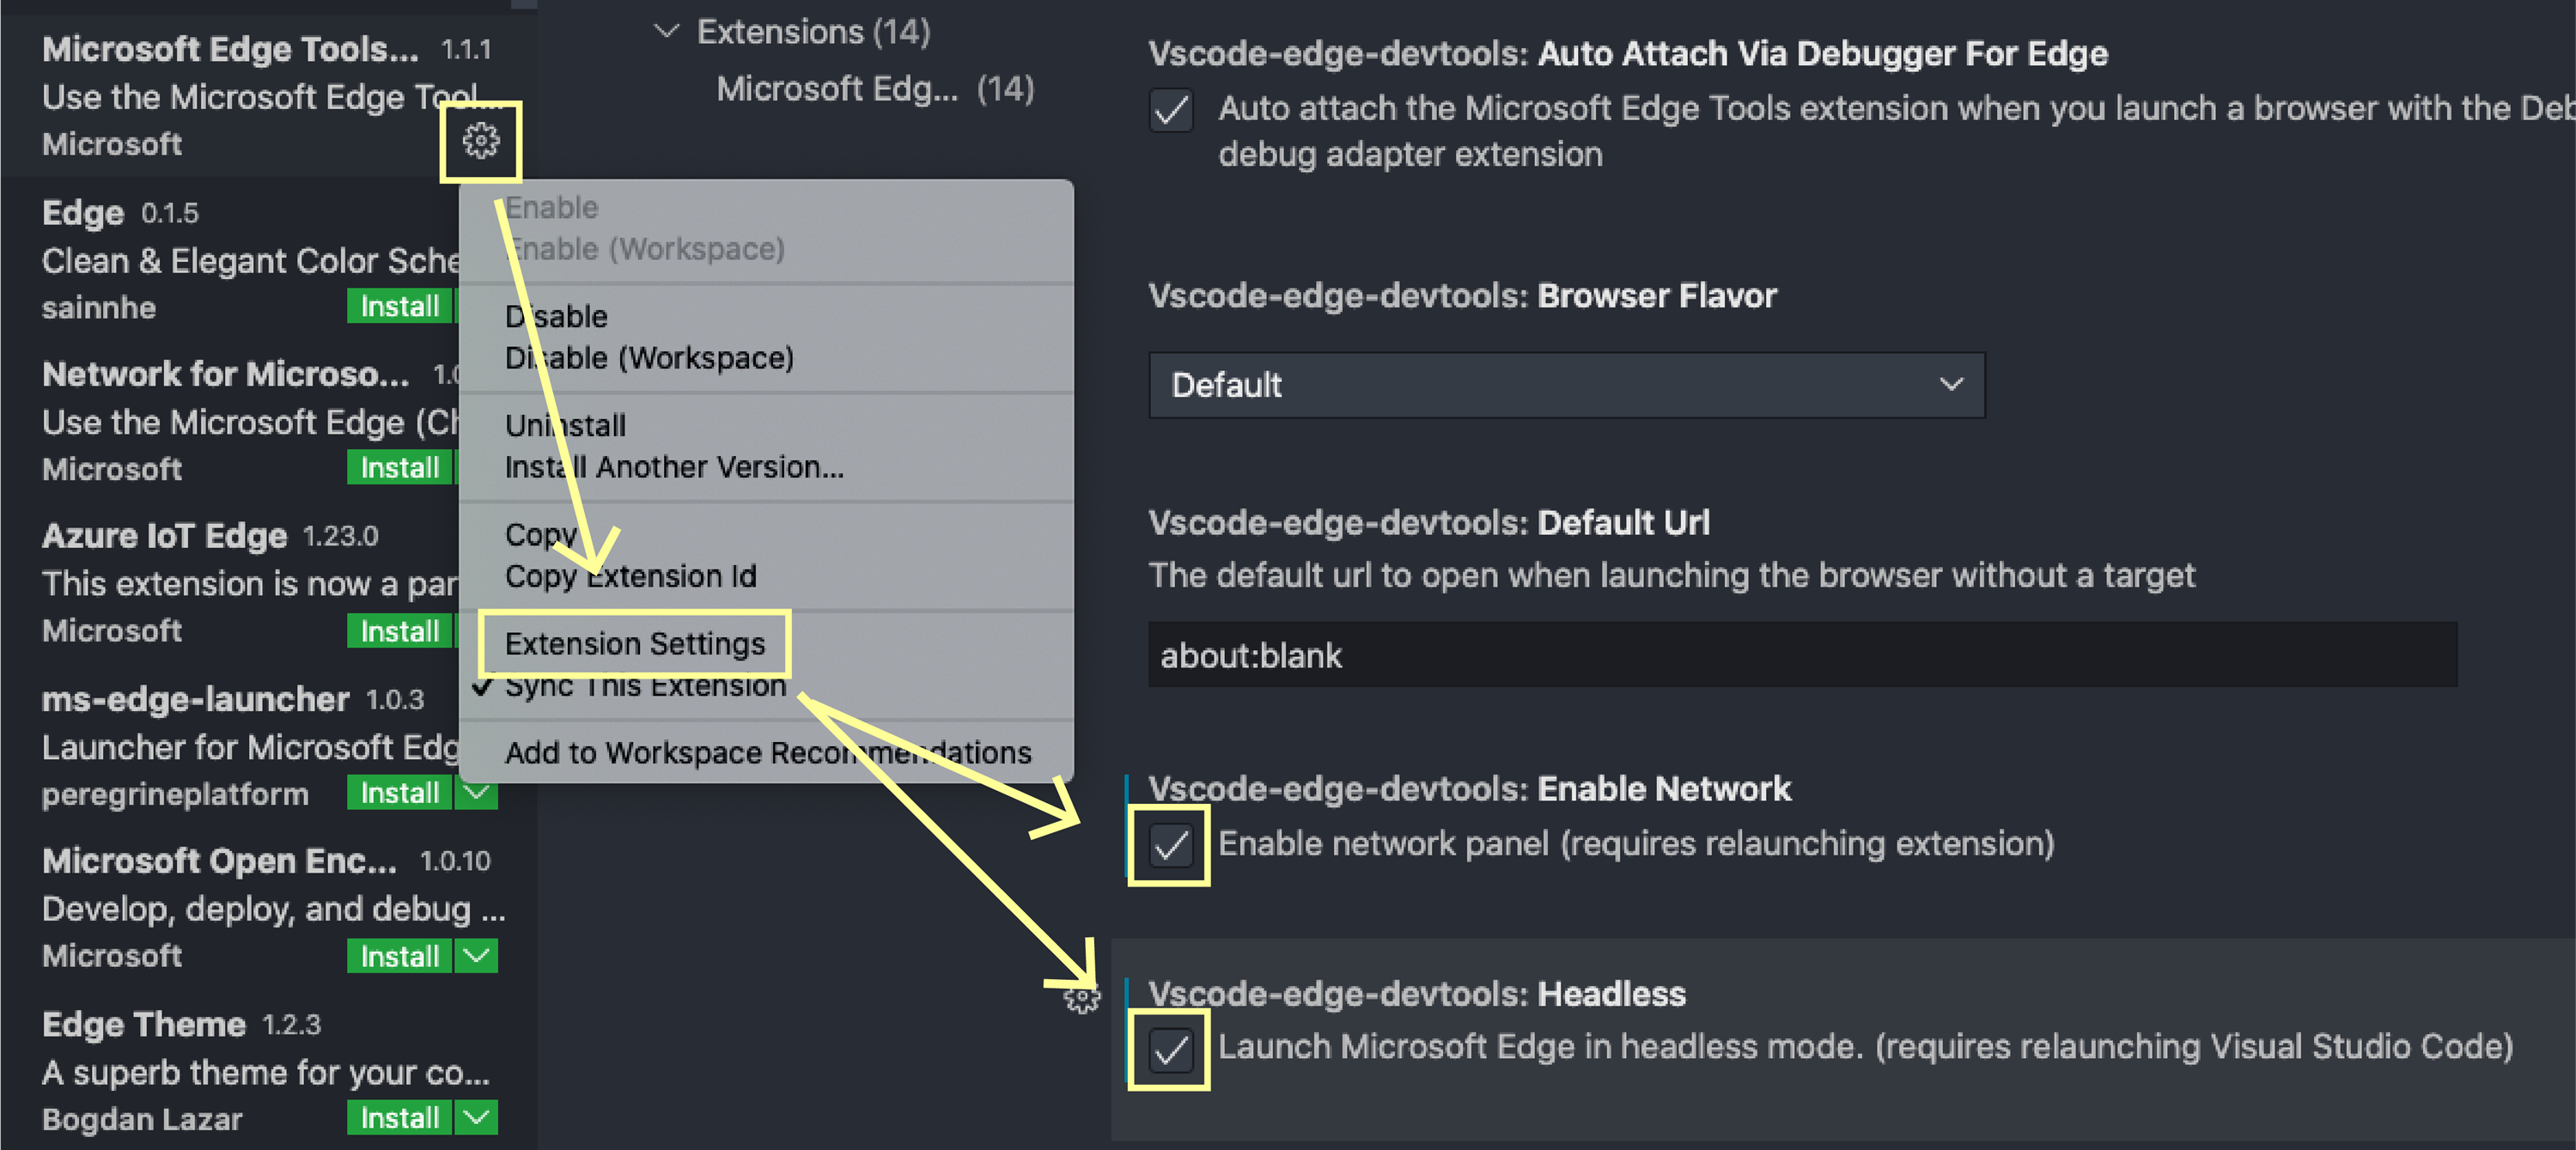
If you would prefer to use only the browser window within VS Code and not have a new window pop up every time, choose the headless mode. This is the most seamless option. To enable headless mode, click on the small gear-shaped icon at the lower right of “Microsoft Edge Tools…”, click on “Extension Settings” in the dropdown, then check “Headless.” - Network Panel
The network panel is another excellent function of Microsoft Edge Tools that gives you an extra tab to view your app’s network activity traffic. You can enable the network panel to enable headless mode by checking the “Enable Network” box. If you wish to use the network panel with full-browser mode, leave the “Headless” box unchecked.
Important: after you have enabled headless mode or the network panel, close VS Code and reopen it to apply your changes.
Step 4: Connect MS Edge to your Web Application
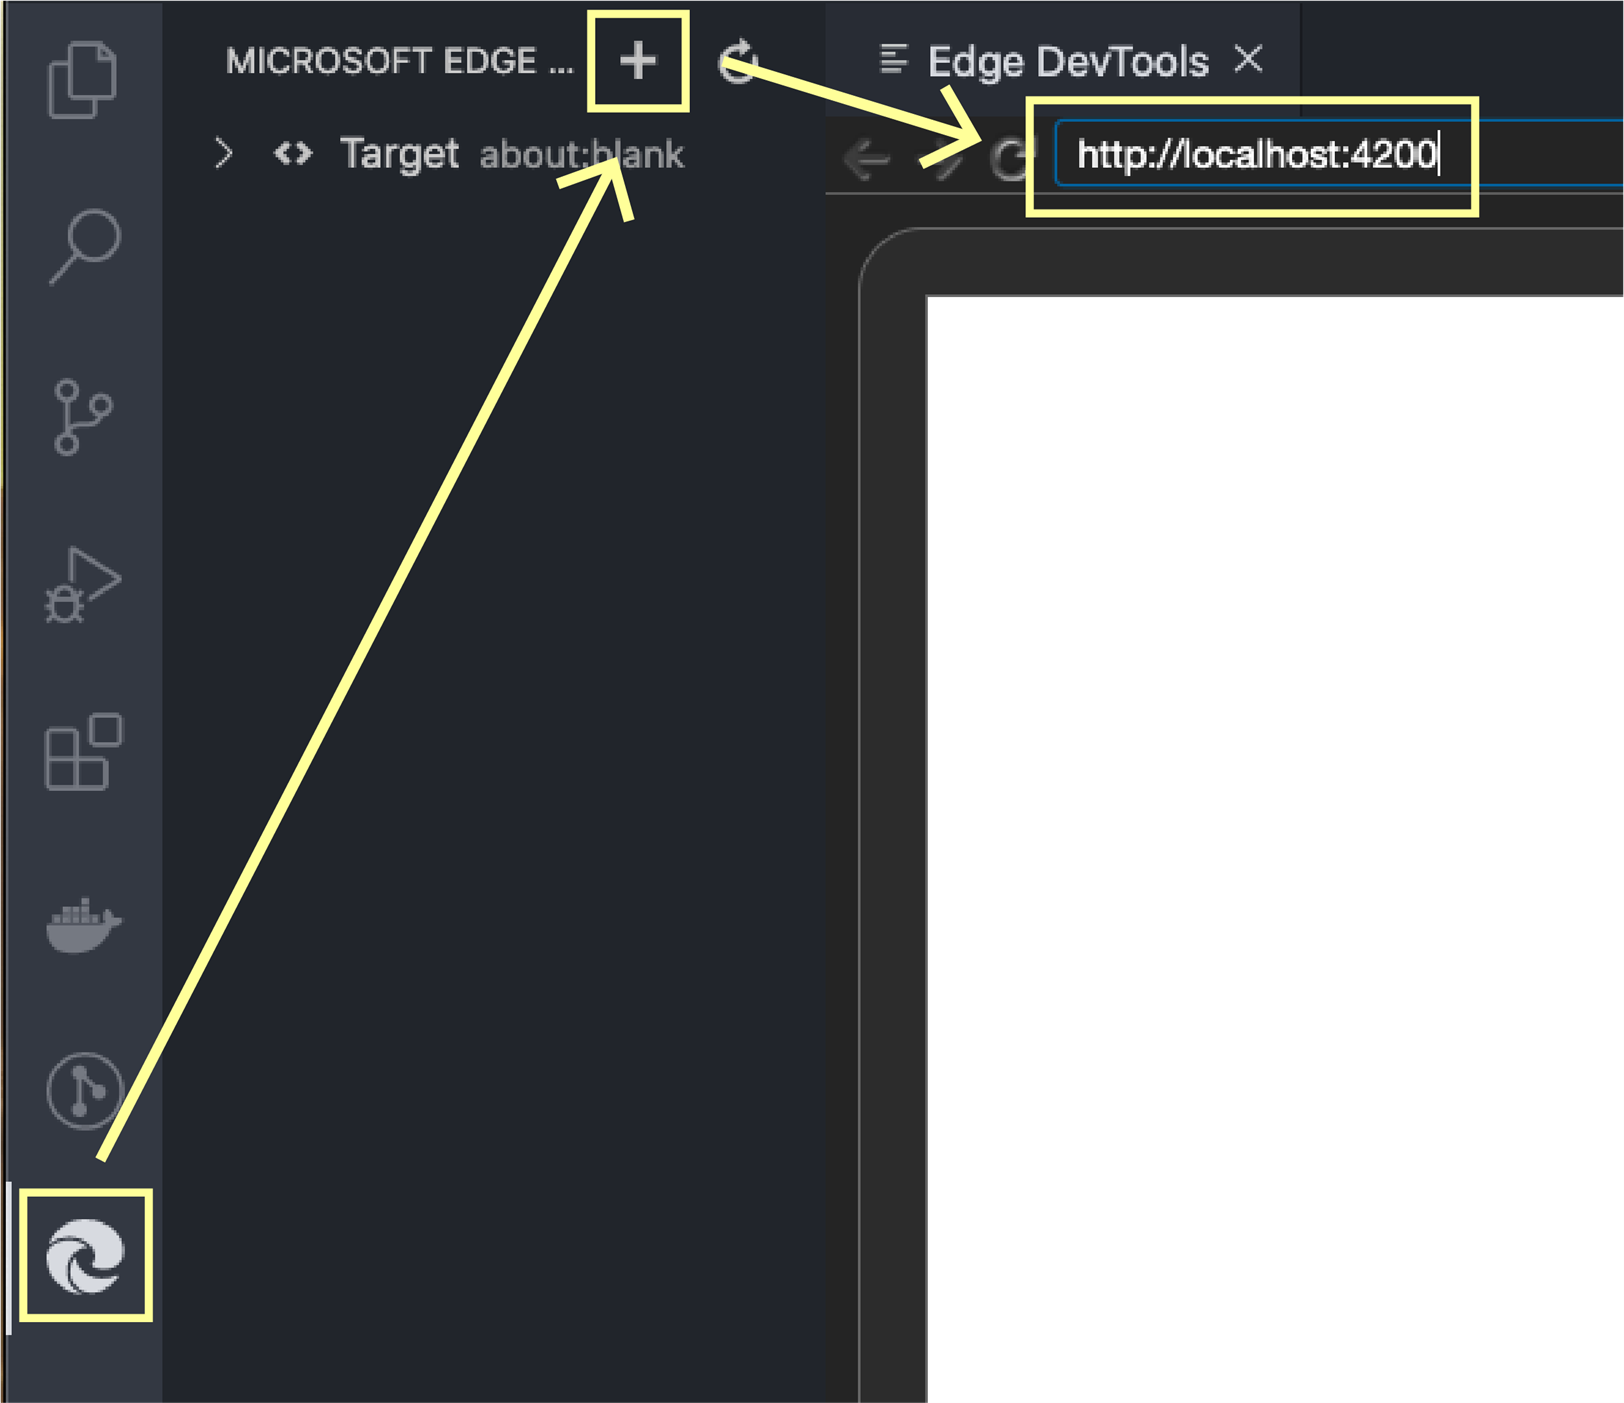
This step requires that you be serving your web application from a local web server and have an URL for that server, for example, “http://localhost:4200”. After you’ve made your changes from step 3 and relaunched Visual Studio Code, open your project folder. Click on the “Microsoft Edge Tools” icon on the left, then click on the plus sign next to the “MICROSOFT EDGE …” at the top. If you have chosen “headless” browser mode, you’ll see an “Edge DevTools” window appear in VS Code. Enter your URL in that window (where it says “about:blank”).
If you have chosen the default full-browser mode when you click on the plus sign, the Edge Tools will open a new browser window, and you should enter your URL in that browser window.
You will also see a browser window appear within VS Code; any change you make will be mirrored in the external browser window and vice versa. You may close the browser window within VS Code if you do not want it or if your screen size is too small to support it.
Conclusion
That’s it! You are now ready to start doing your development and debugging in one harmonious environment. To learn more about making the most of Microsoft Edge Developer Tools for VS Code, visit the extension documentation. It’s a great place to start.