


Do your users want reports in SharePoint? Yes! They crave reports and charts. Regardless of which version of SharePoint they are using, getting started now to build their data visualizations in Power BI will position the reports for seamless migration to future SharePoint versions. These are the necessary steps to take to add a simple report in a SharePoint modern page.
Important note: To embed Power BI reports in SharePoint Online, a Power BI Pro license is required.
The Process Flow
This is the flow:
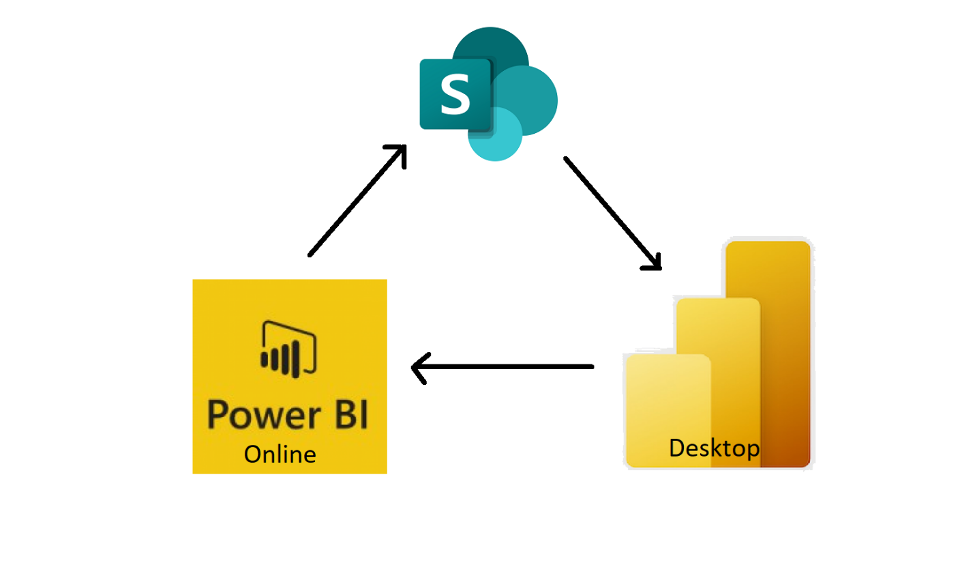
Figure 1: The Process Flow
- Create your data in SharePoint; say a list or library.
- Start Power BI Desktop to connect to SharePoint to read the data and transform it and create visualizations.
- Publish to Power BI Online, where a link becomes available to paste into the Power BI webpart available in SharePoint Modern pages.
We’ve gone full circle! Let’s look at the steps.
SharePoint Online Data
For this example, we will read data from a simple custom list. I added the list to my SPO Dev Tenant site named Vacation Planner. Since all our “vacay” are now “staycay,” I decided to make a board game list. Along with the default Title column that you get with any new list, I added three more. Each is a number column. Then I added games to the list; I listed every game I could think of. For each one, I entered somewhat random numbers for Difficulty and Minimum age and Popularity, although I am pretty sure Candy Land is for 4-year-olds.
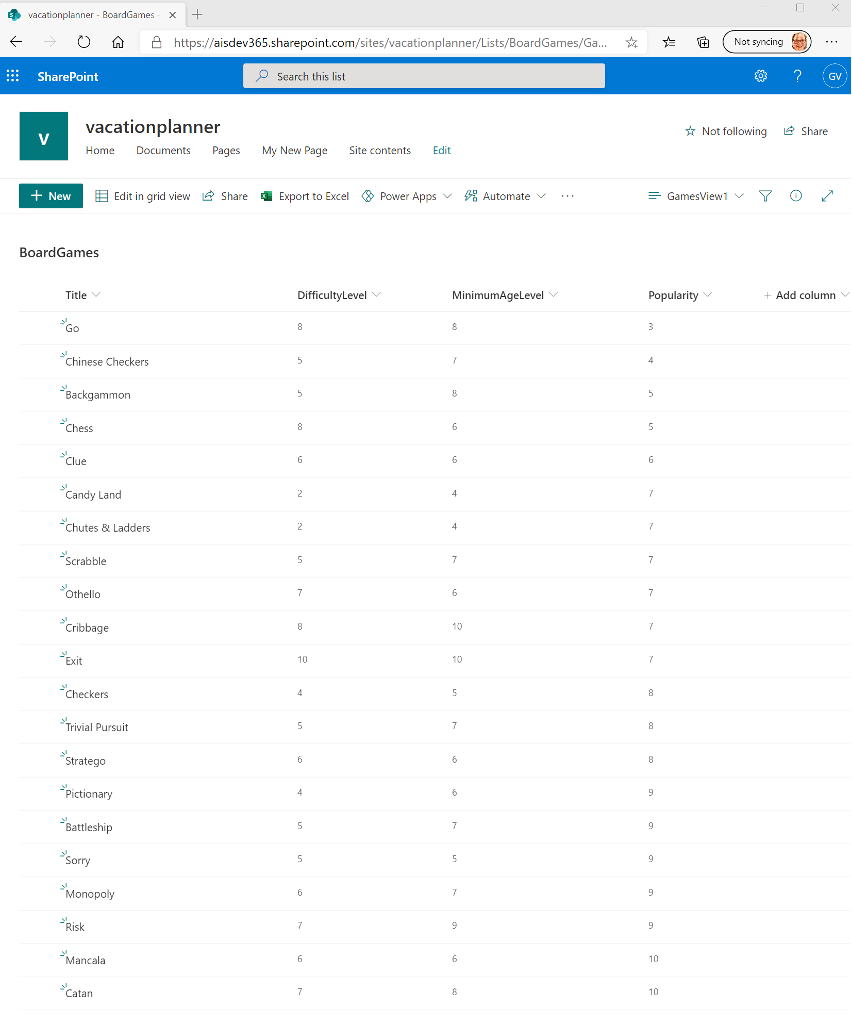
Figure 2: Board games list
To create the list, I was logged into SPO as a fictitious test user I named Gwen Lim.
Build the Report
Install the Power BI Desktop application to build the report. It’s free: download it here.
On first use, you will be prompted to sign in. If the login type option appears, choose “Organizational” and log in with a Windows account. I logged in with fictional Gwen Lim’s account. The app, either from the startup splash screen or the menu, chooses “Get Data.”
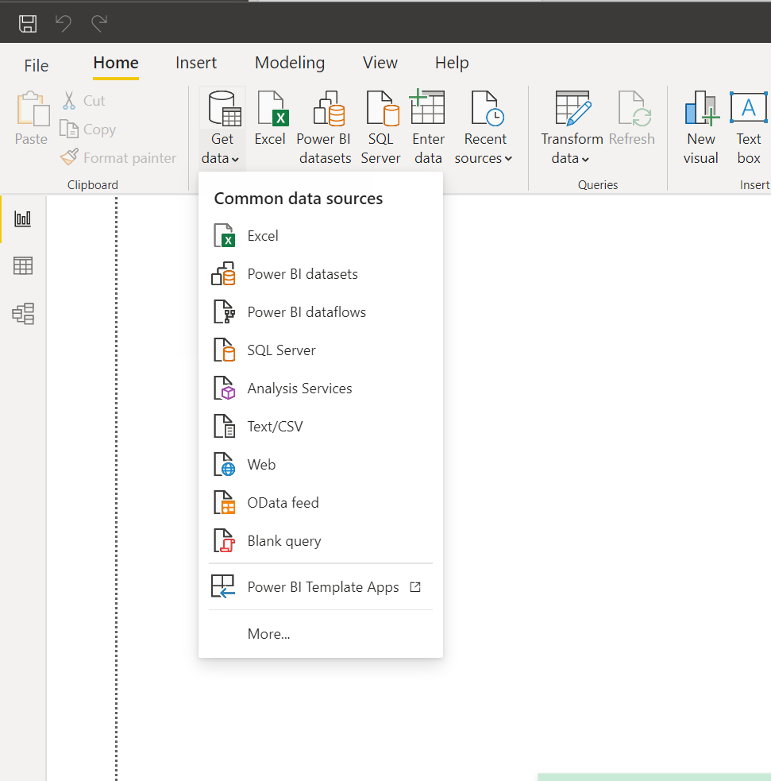
Figure 3: Select a data source
From the Common data sources dropdown, select “More…” at the bottom. Then click the “Online Services” option, and you should see “SharePoint Online List” on the right. Select that and then click “Connect” at the bottom.
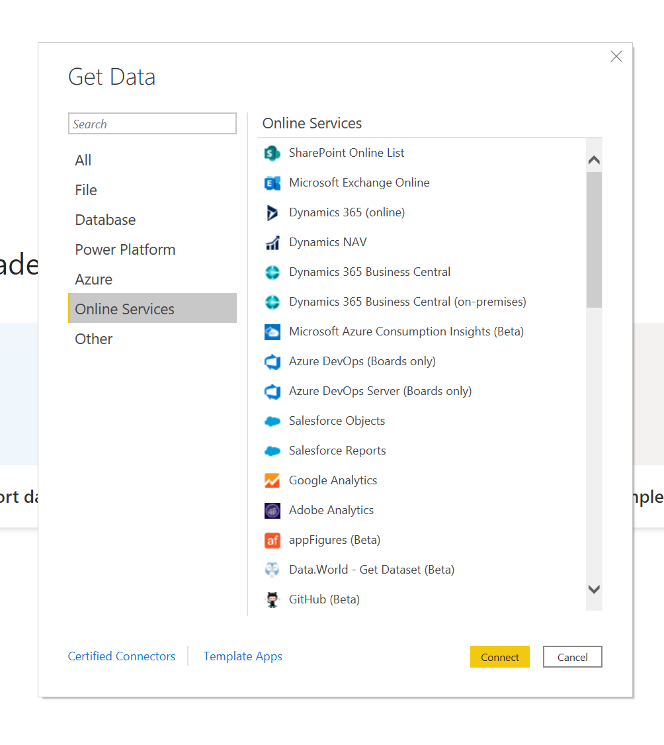
Figure 4: We will choose SharePoint online list
In the SharePoint Online Lists dialog, paste the address URL of the SharePoint site that contains your list. You can check the 2.0 (Beta) radio button (see figure 6) to enable the app to open the default view of your list or leave it 1.0 if you prefer.
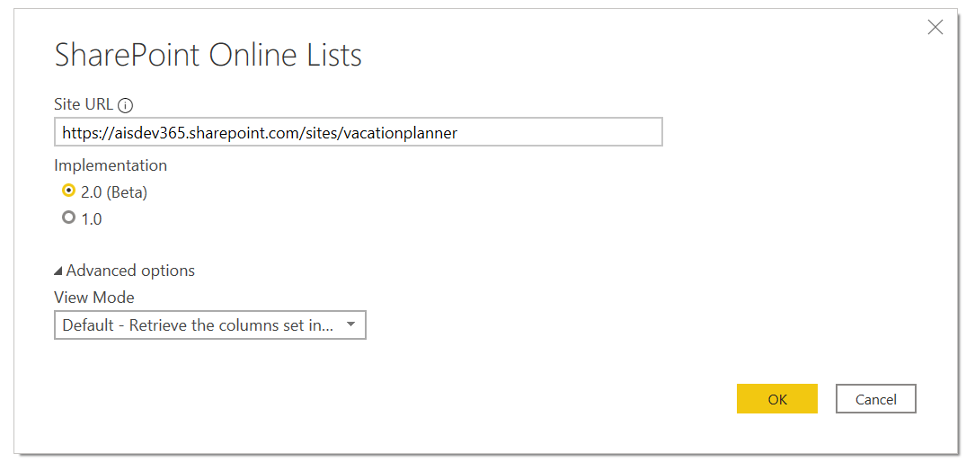
Figure 5: Enter the SharePoint site URL
A Navigator window appears with all of the lists available in the SharePoint site in the left columns with checkboxes. Then, check BoardGames to see a view of the data in the right side of the pane. Click the Load button.
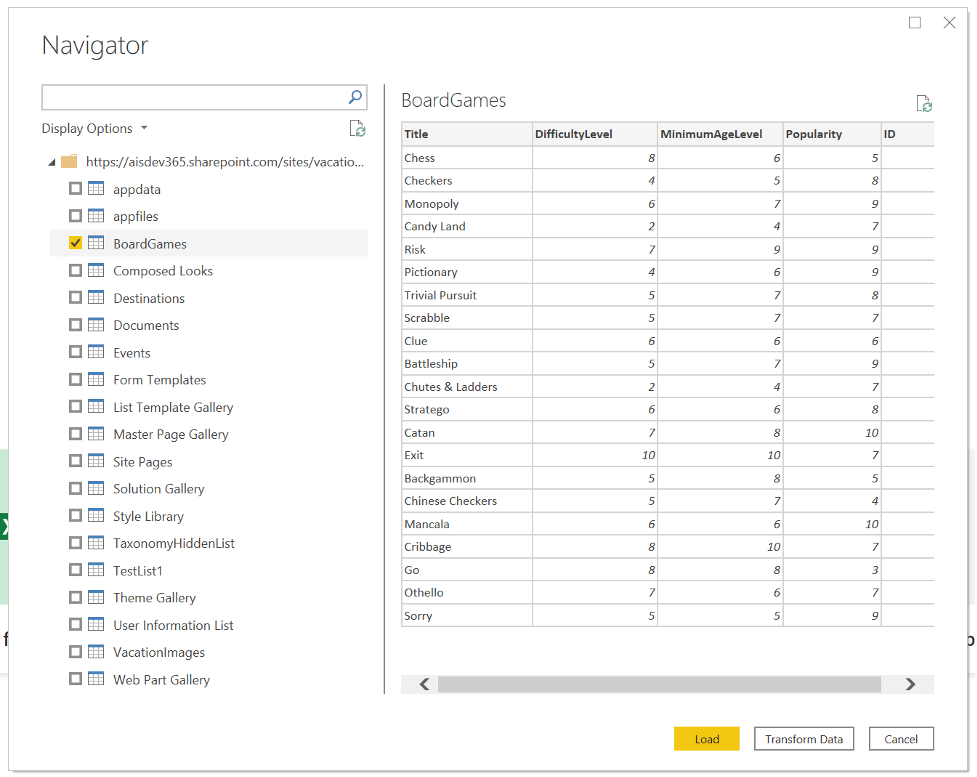
Figure 6: Select the List
You can start building the report. The fields of the data display on the right side. Having chosen a specific, limited column view as default for the list, along with selecting the 2.0 radio button, you will see only a few fields (aka columns) on the right, which is easy to work with.
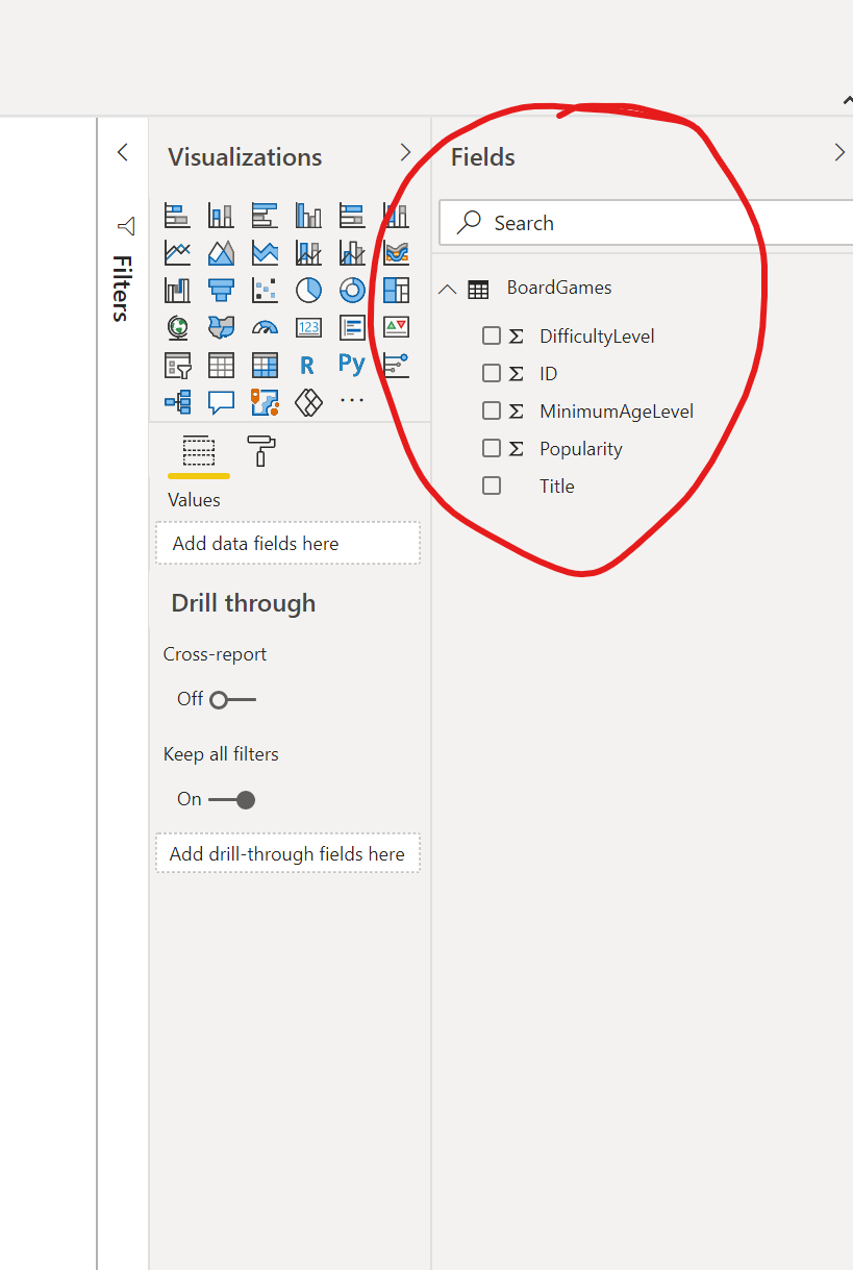
Figure 7: The BoardGames list fields appear
Ignore the fields for a moment while you chose a Visualization. Select the doughnut. Now, it’s time to apply fields to the doughnut. Drag Title into the Legend box under Visualizations. A legend appears beside the doughnut chart. Drag Popularity into the Values box, and your doughnut comes to life with color.
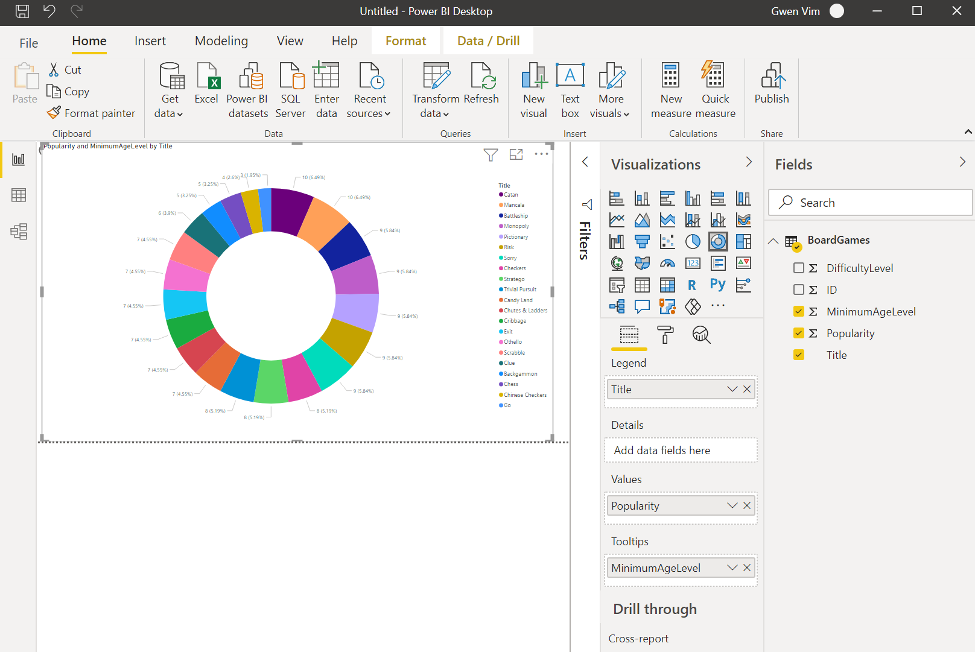
Figure 8: Pick a visualization chart and add fields
When you hover the chart, tooltips appear with data for each game. Age level, Difficulty, and Popularity values have been imported as decimal values, which would be more readable as whole numbers. To alter this, and to edit column heading text, click on the ribbon’s Transform Data button.
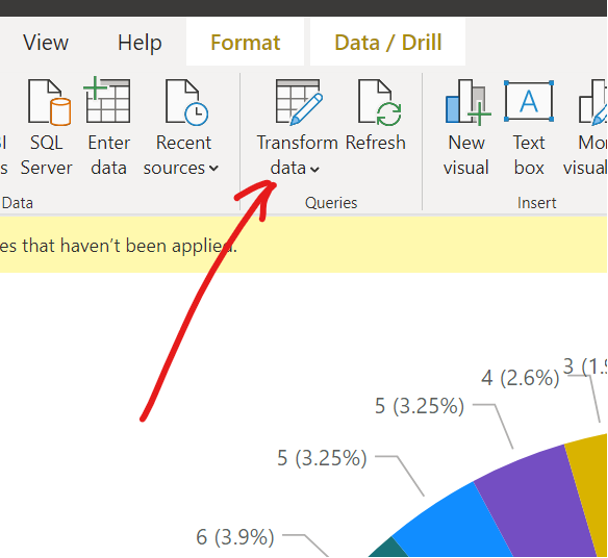
Figure 9: Modify the data
To change the column value from a decimal to a whole number, click the column title to select it and then click on the ribbon’s Data Type button. Select Whole Number as in figure. Double click the column heading to rename the column.
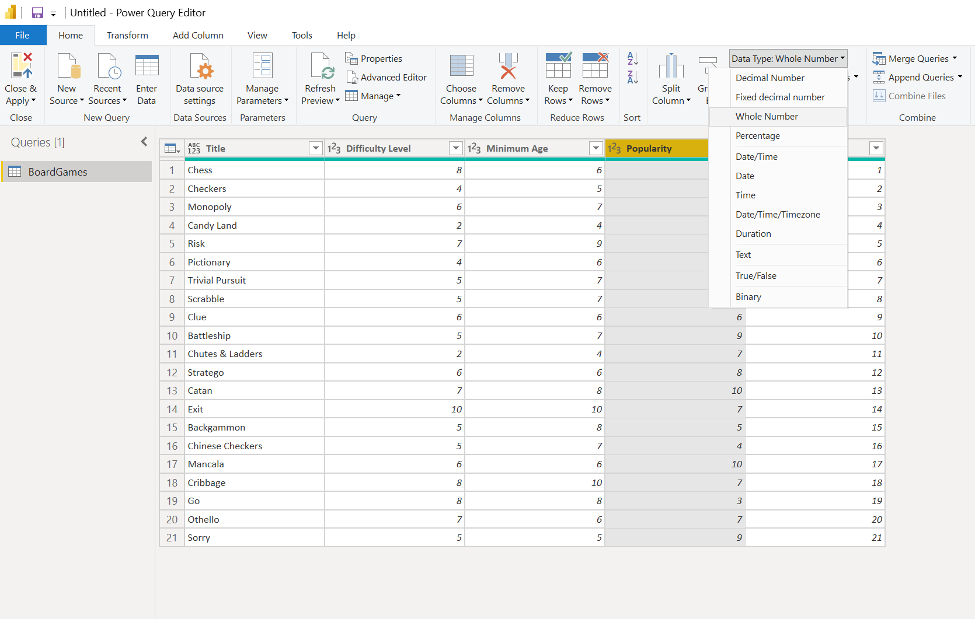
Figure 10: Changing field titles and data types
Click the Close & Apply button on the left in the ribbon to cause the visualization to appear with the changes applied. Now when you hover your cursor over a section, Minimum Age will appear with a space and both values as whole numbers.
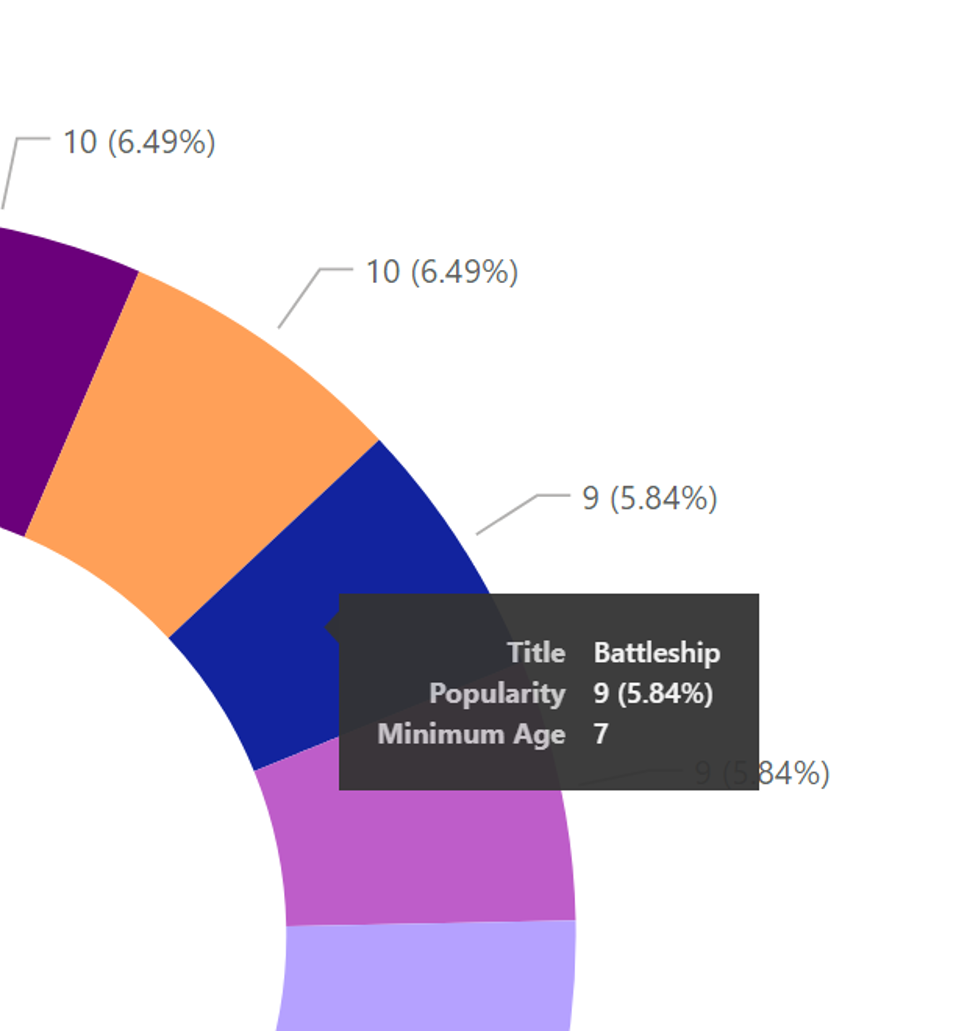
Figure 11: Improved tooltips
Display in SharePoint
To display the report in SharePoint, click the Publish button in the ribbon on the right side. You will be prompted to save your report in .pbix format.
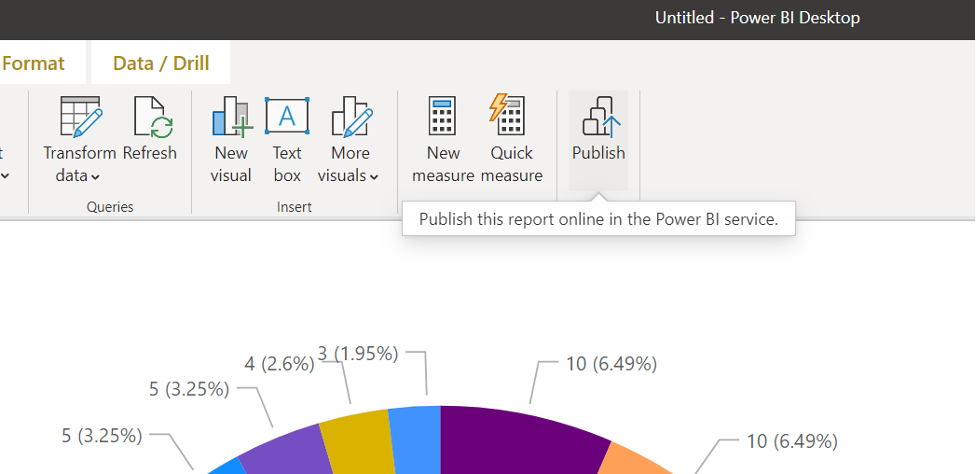
Figure 12: Ready to publish!
Save anywhere you want to keep it, and then the Publish to Power BI dialog appears. Varied workspaces can be configured, but initially, you only have “My Workspace” as an option, which is fine. Select it and then click “Select.”
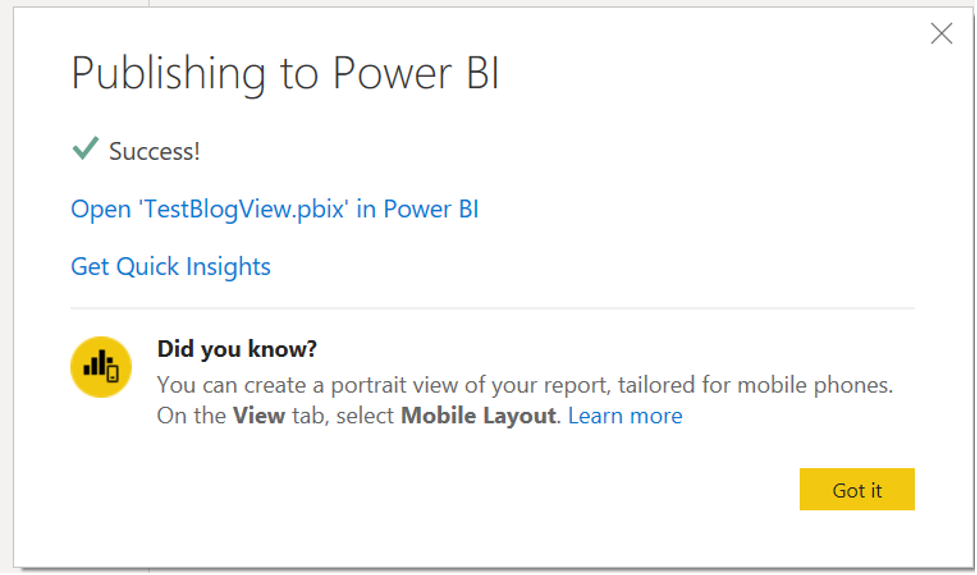
Figure 13: Successful publish to Power BI Online
When you see the Success! dialog, click on the link to open the .pbix in Power BI online to view your report. In the Share menu above the report, drop down the menu options, and hover over Embed report. Here you want to see an option for SharePoint online.
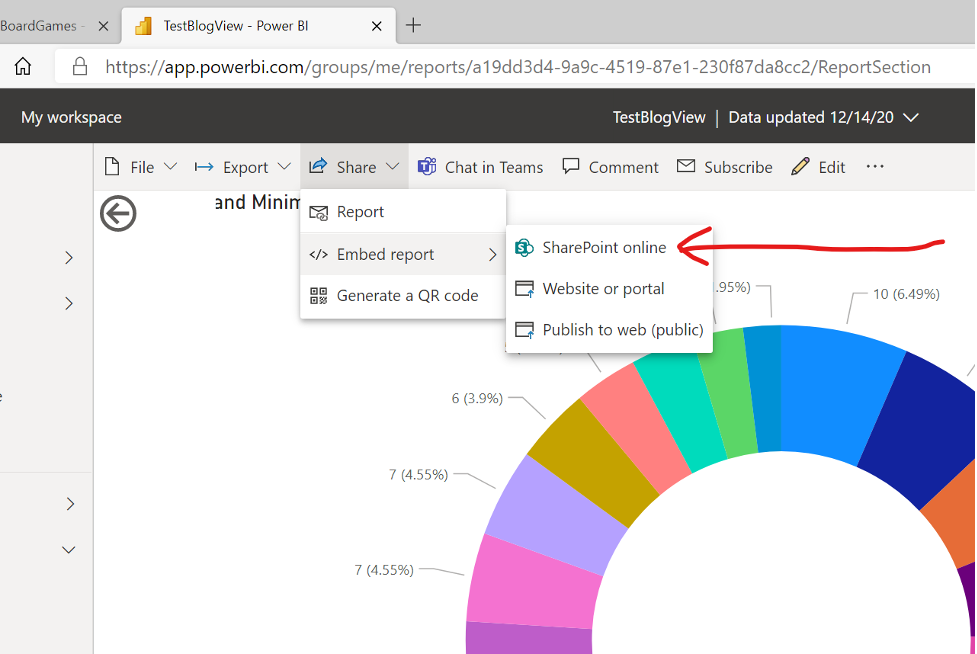
Figure 14: Get a link to use in a SharePoint page
This will be missing until you upgrade to a Power BI Pro license. This is not free, but the trial is for 60 days. Once you have that option in the menu and select it, you are rewarded with the Embed link to use in SharePoint.
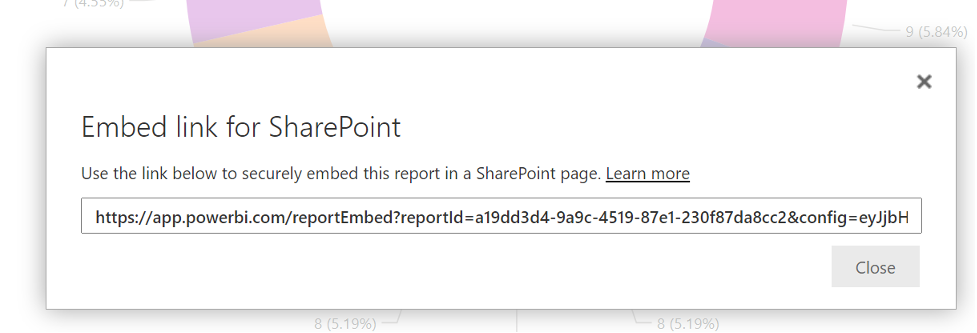
Figure 15: Click to highlight and then copy
Click that link to highlight it and copy. Now head over to your SharePoint site and create a page.
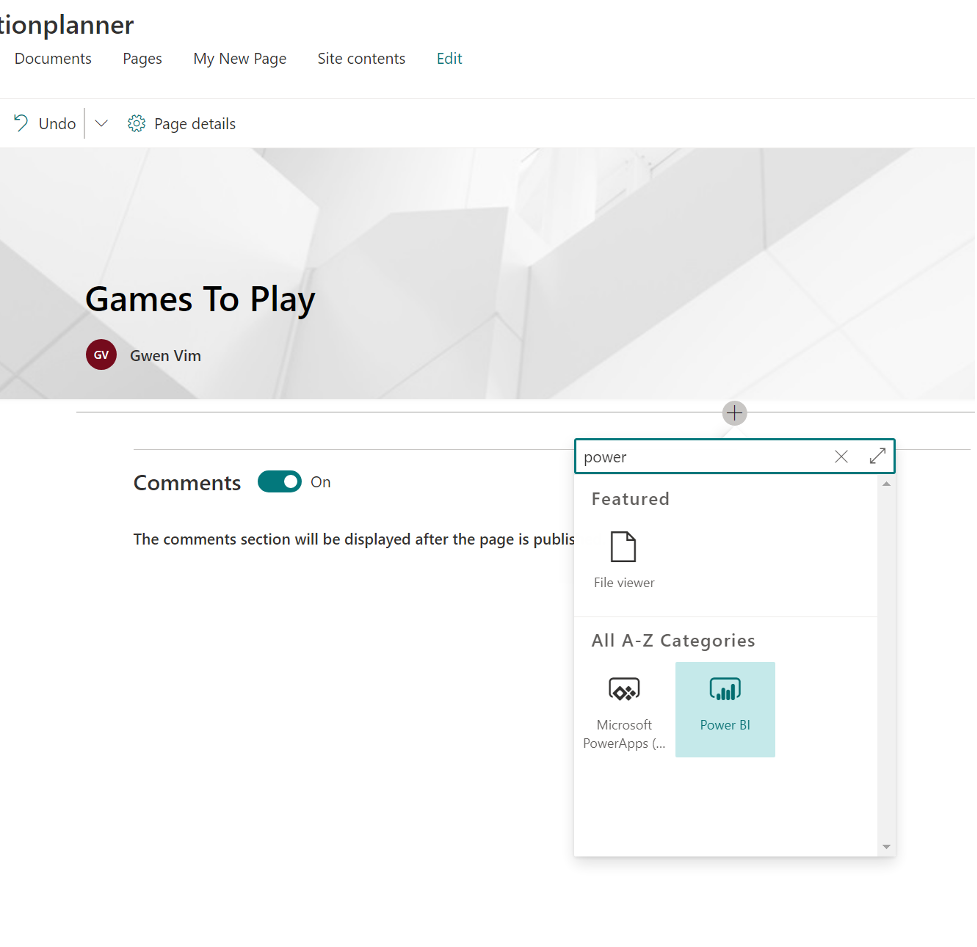
Figure 16: Locate the built-in Power BI webpart
Click the webpart plus sign, and in the search box, type “power” to filter the results. The Power BI webpart will appear. Click on it, and the webpart will be inserted into your page. You will see a green button for Add report; click it to open the properties panel on the right. Paste in the embed link you got from Power BI online.
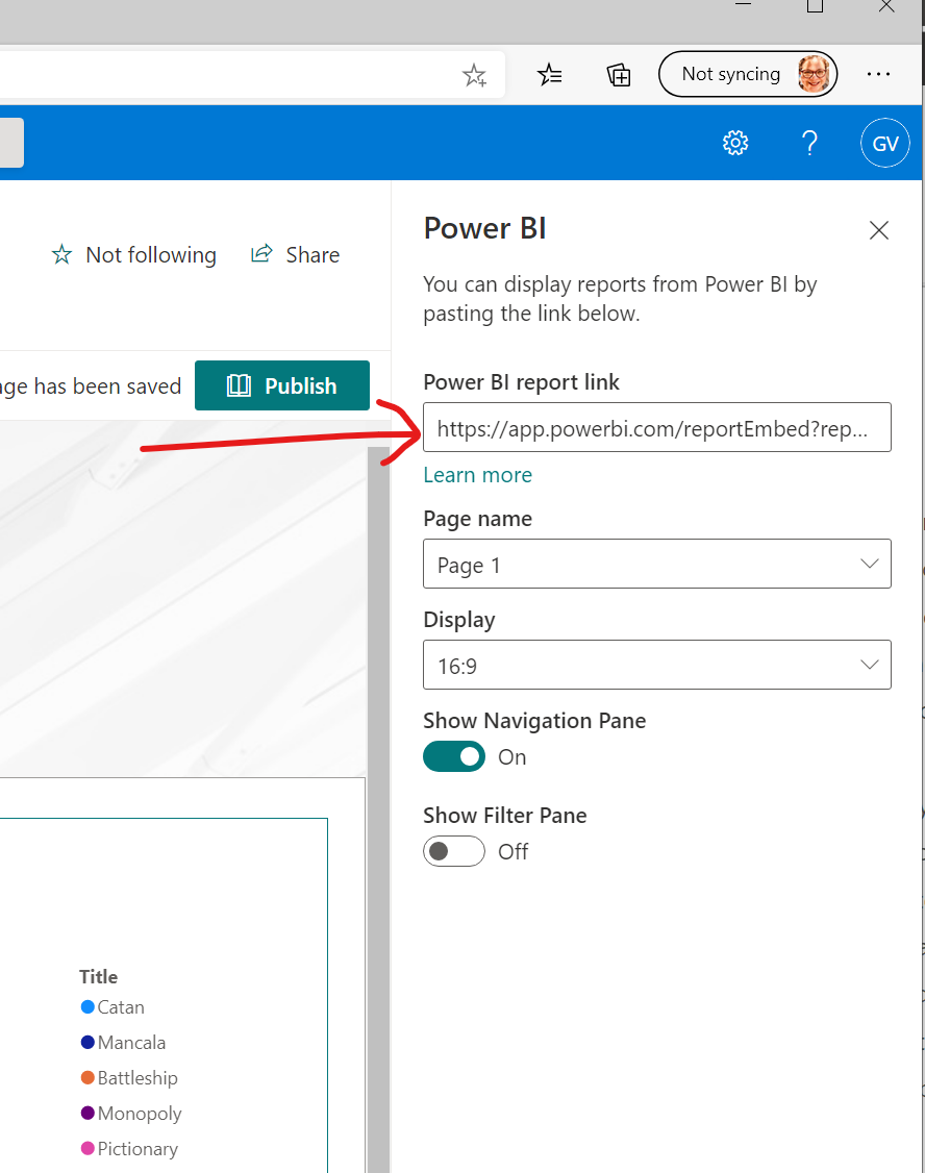
Figure 17: Apply the embed link
Click away from that textbox and your report will appear on the left.
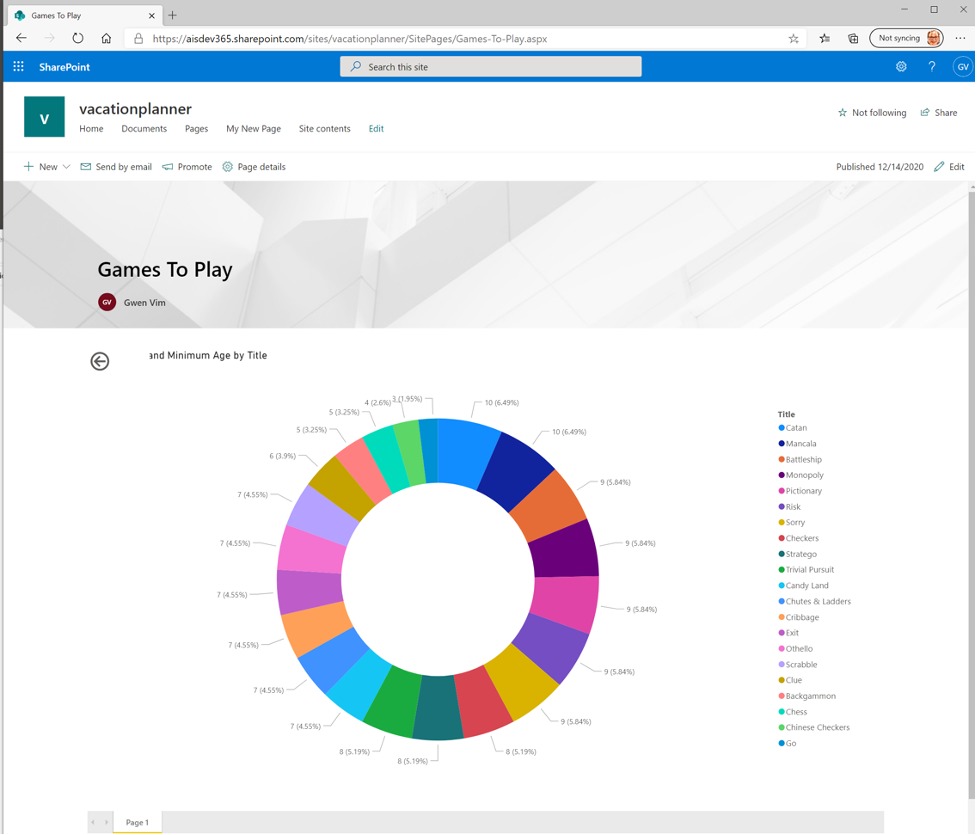
Figure 18: Report successfully displayed in SharePoint Online
Conclusion
This is a no-code solution and a simple demo. However, the depth of tooling provided by Power BI to enable developers and business data experts to transform and visualize organizational data is immense. The speed and ease with which we can integrate data reporting into SharePoint modern pages will be welcome to customers as they migrate to current SharePoint versions.
Links
Embed a report web part in SharePoint Online – Power BI | Microsoft Docs