 I was recently asked to write my own custom performance metric and publish it to Amazon’s CloudWatch using PowerShell.
Part I: How do I get this thing running already?
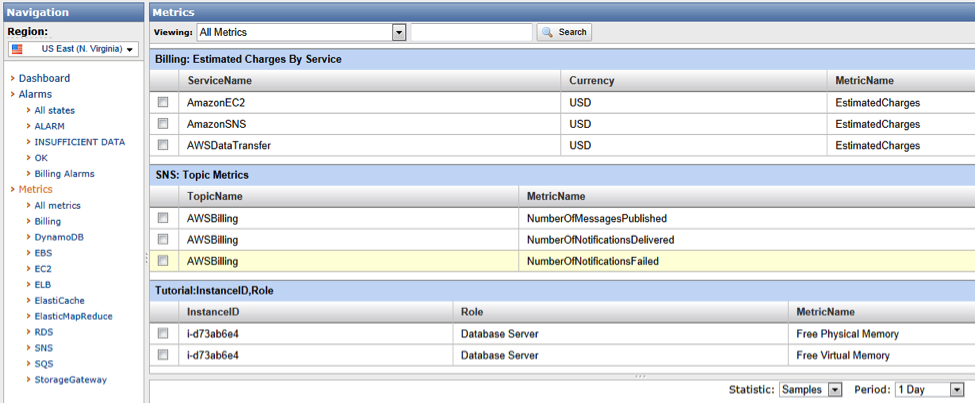
I initially used this blog post as a general guide, but since I had some experience with PowerShell already, the real learning part for me was how to call the API through .NET. (There is a second part, which actually shows you how to publish the metric. Unfortunately, his test “Tutorial” namespace ended up in the wrong region [US East] as compared to my instance [US West Oregon].
I figured out the correct way to do this by teasing apart the free community scripts available on AWS, which I will discuss later (see Part 2).
So here is what you will need in order to write your own custom performance metrics or at the very least call the ones already written and available for download.
1) Download the AWS SDK for .NET
2) Install this on your working instance.
3) You can use any script editor you feel comfortable with, however, if you choose to use the built in ISE editor for PowerShell, be aware of one issue concerning signing. If you create files in the ISE editor, you cannot sign them with your own certificate.
4) Set your PowerShell execution policy to RemoteSigned or Unrestricted (not suggested in a production environment).
5) Download the Amazon CloudWatch Monitoring Scripts for Microsoft Windows Server.
6) Instructions on how to call these is also available from here.
7) Make sure you enable detailed metrics on your instance. Follow these instructions.
If you just download and try to execute one of the scripts, you will get an error stating that script execution is denied by the execution policy of the machine. Right…so we just change the execution policy using Set-ExecutionPolicy RemoteSigned. Except that it still won’t work because you have downloaded these scripts from the Internet and they are not signed.

What I found out rather quickly is that in order to sign a script, I had to create my own self-signed certificate using MakeCert.exe. The instructions on how to do this are available through the PowerShell interface, by typing the following command: get-help about_signing
Here you will find instructions for creating a script to digitally sign any .ps1 file you create. The script is below:
## add-signature.ps1

## Signs a file

param([string] $file=$(throw "Please specify a filename."))

$cert = @(Get-ChildItem cert:\CurrentUser\My -codesigning)[0]

Set-AuthenticodeSignature $file $cert
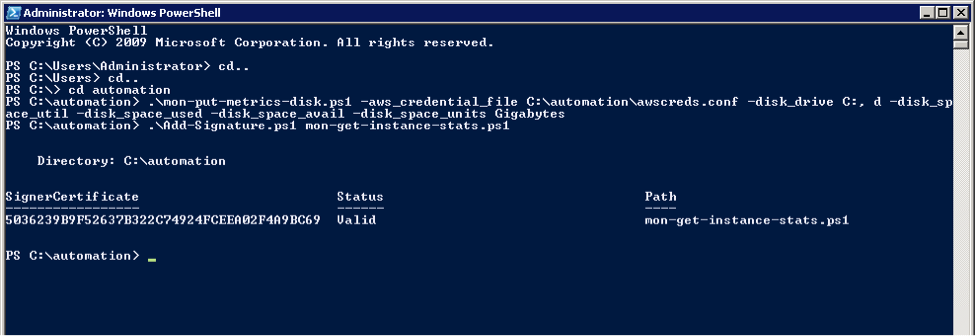
Save that to a file Add-Signature.ps1 and then sign your scripts as such .\Add-Signature.ps1 MyScript.ps1
(Note: If you get an ‘Unknown’ error, you probably used ISE to copy and paste, try Notepad.)
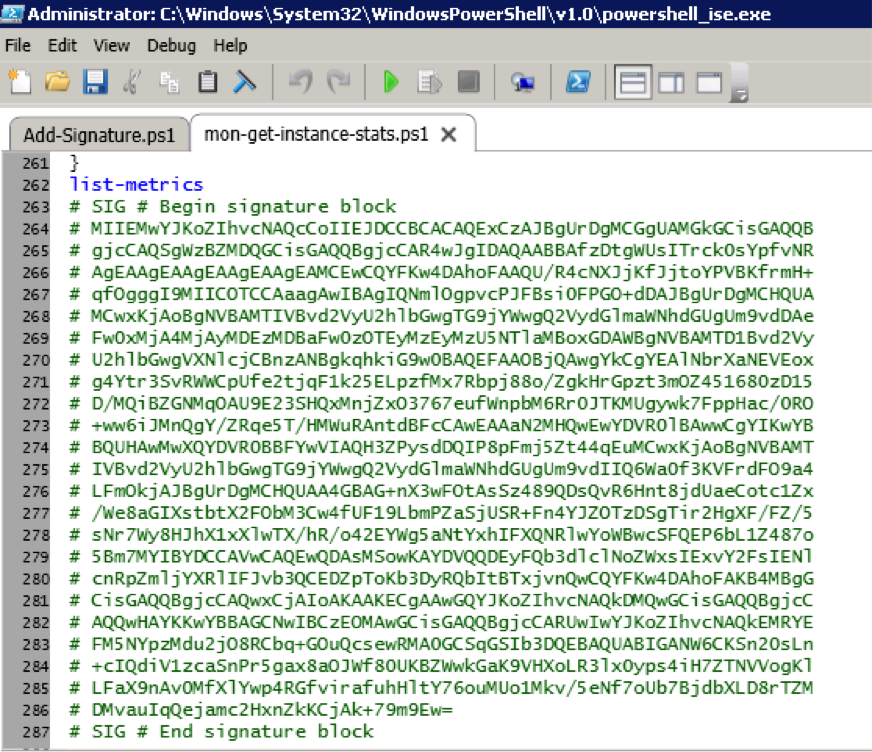
You can actually just open up the script file and scroll to the bottom, copy the certificate signature block and paste it into any other file you want to run signed with this certificate.
However, in a production environment, you will want to sign this with a valid certificate from a third-party issuer.
The first thing I did before calling any of the monitoring scripts was to put my AWS access and secret keys into a text file called awscred.conf so I could easily call the script with any parameters and not worry about credentials. This will also help when you set up the script to be called as a scheduled task.
When you make calls to any of the “put-mon” scripts, you will not get back a response even if the script executes successfully. That is why I used the –verbose parameter to see what was going on exactly:
.\mon-put-metrics-disk.ps1 -aws_credential_file C:\automation\awscreds.conf -disk_drive C:, d -disk_space_util -disk_space_used -disk_space_avail -disk_space_units Gigabytes –Verbose
Also, after you successfully publish the metric, you can see the actual statistics via the following script with a timeframe, included in the download:
.\mon-get-instance-stats.ps1 -aws_credential_file C:\automation\awscreds.conf -recent_hours 2
The CloudWatch console will also show you the metrics you have published, but no data (this seems to be a bug only in IE) appears!
I switched to Chrome and my data graphs were now showing.
Really cool: If you mouse over any of the metrics you have selected, you can create an alarm right from here.
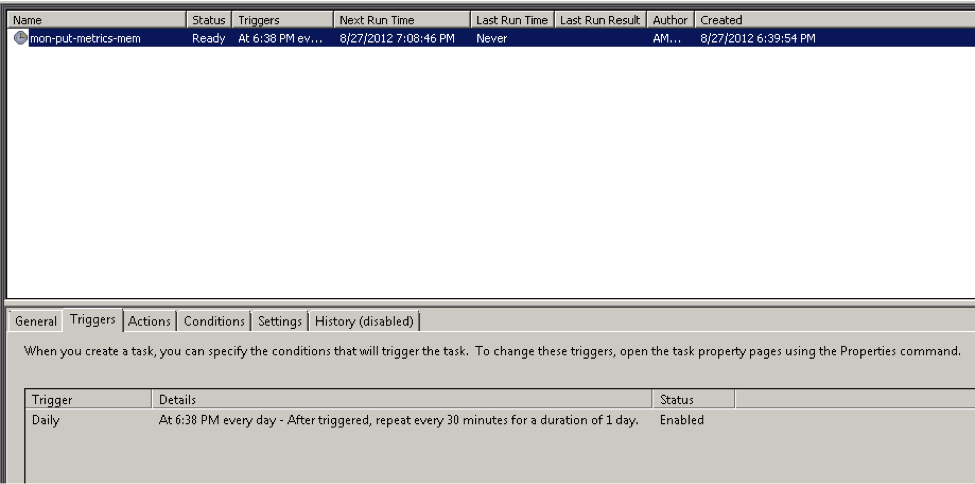
The final step was to set this up as a scheduled task, so that I would get metrics published at a steady pace. That is where the second part of the original blog I used came in handy. I ended up creating a new task and pointing to the powershell.exe program, passing it the script and parameters as an argument, like this:
-Command "& c:\automation\mon-put-metrics-mem.ps1 -aws_credential_file C:\automation\awscreds.conf -mem_util -mem_used -mem_avail -page_avail -page_used -page_util -memory_units Megabytes -from_scheduler -logfile C:\automation\mon-put-metrics-mem.log; exit $LASTEXITCODE"
I figured out the way to get back the status of the last run from this guy’s post.
I set up a schedule to repeat every day and set the trigger to execute the task every 30 minutes for a day.
Now I get deltas on the graph that show my metrics are being published correctly.
Part 2: The Nitty Gritty
If you are like me and not content to leave well enough alone but monkey about in the internals of a script, there are a few things you can learn from these scripts. Here are a few nuggets of wisdom:
Set up parameters.
You should always set up mandatory parameters so that your scripts don’t fall down go boom. In this case, I did that, and I also set up a new object to hold my “keys to the castle” and then dumped the variables.
##Incoming Parameters

Param(

[parameter(mandatory=$true)][string]$EC2AccessKey,

[parameter(mandatory=$true)][string]$EC2SecretKey

)
##Creates and defines the objects for the Account

$AccountInfo = New-Object PSObject -Property @{

EC2AccessKey = $EC2AccessKey

EC2SecretKey = $EC2SecretKey

}
##Removes unused variables

Remove-Variable EC2AccessKey

Remove-Variable EC2SecretKey
This allowed me to create the AWS client as such.
$client=[Amazon.AWSClientFactory]::CreateAmazonCloudWatchClient($AccountInfo.EC2AccessKey,$AccountInfo.EC2SecretKey)
Don’t hard code paths to the SDK.
Not that I think it will change anytime soon, but to be safe, use the Amazon script way of loading the dlls.
##Loads the SDK information into memory

$SDKLibraryLocation = dir C:\Windows\Assembly -Recurse -Filter "AWSSDK.dll"

$SDKLibraryLocation = $SDKLibraryLocation.FullName

Add-Type -Path $SDKLibraryLocation
Use functions to get the correct end point.
I pulled these right from the original script, spelling errors and all. However, as you can see they make sure you are grabbing the correct region that your AMI is in. This allows the metrics to be published where you would expect them.
### Functions that interact with metadata to get data required for dimenstion calculation and endpoint for cloudwatch api. ###

function get-metadata {

$extendurl = $args

$baseurl = "https://169.254.169.254/latest/meta-data"

$fullurl = $baseurl + $extendurl

return ($wc.DownloadString($fullurl))

}

function get-region {

$az = get-metadata("/placement/availability-zone")

return ($az.Substring(0, ($az.Length -1)))

}

function get-endpoint {

$region = get-region

return "https://monitoring." + $region + ".amazonaws.com/"

}


