


Application Performance Management (APM) is the monitoring and management of performance and availability of a software application. A proactive approach to monitoring the application can reduce business escalations and increase the availability of an application to greater than 99.9%. It helps detect and diagnose complex application issues with minimum effort. The customer experience quotient is a powerful metric to understand whether the end-user of an application is pleased or disappointed depending on how the application is performing. The APM tools can be used by IT and business teams to better understand the pain points for the customers and identify opportunities to constantly improve the features of an application. The tool monitors multiple aspects of an application like the application layer, network servers, integration point to other systems, database, workflow process, etc.
Dynatrace is a software-intelligence monitoring platform that simplifies enterprise cloud complexity and accelerates digital transformation. It can be used for Real User Monitoring, Mobile App Monitoring, Server-side service monitoring, Network monitoring, process, and host monitoring, Cloud and Virtual Machine Monitoring, Container Monitoring, and Root Cause Analysis.
In this article I will explain the process of setting up a Dynatrace Synthetic Browser Type Monitor which helps monitor the availability and performance of web applications as experienced by an end-user. It provides 24/7 visibility to how an application is performing which helps application teams in critical decision making. Dynatrace offers two types of Synthetic monitoring.
- Browser Type Monitors
- HTTP Type Monitors
Google Chrome is the supported browser for building synthetic monitors.
Creating a Browser Monitor
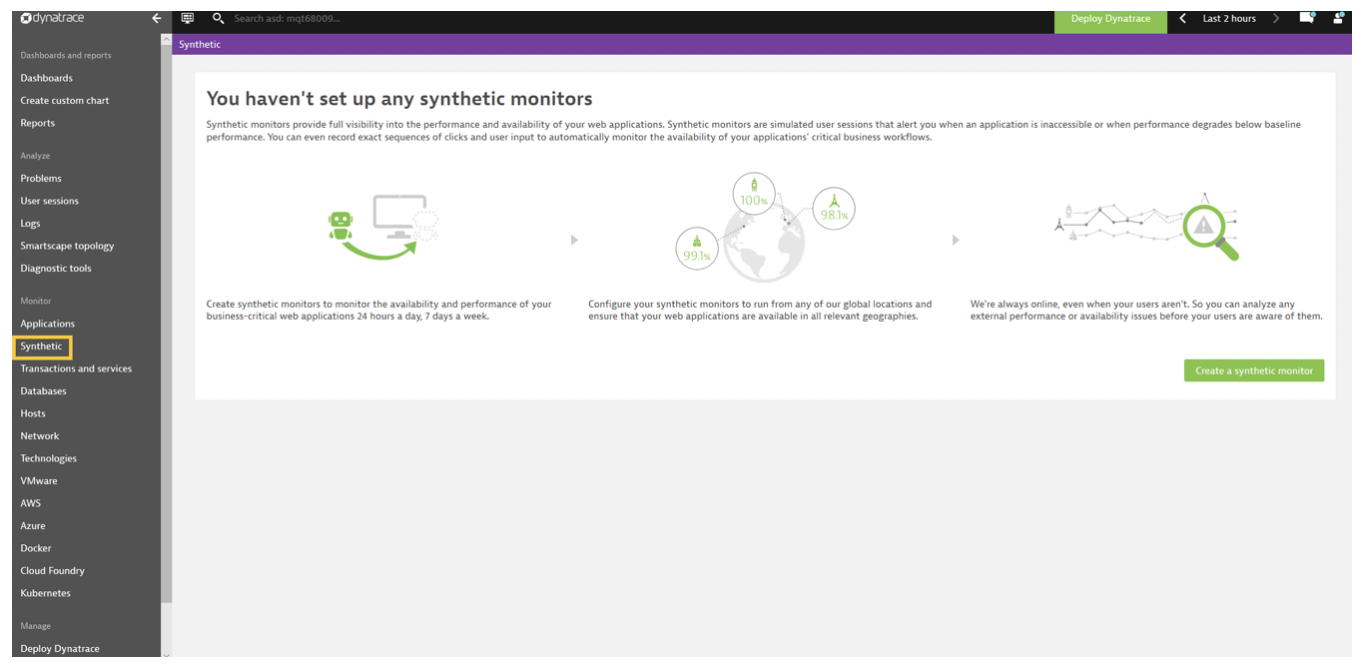
After logging into Dynatrace with the appropriate credentials click on the Synthetic Option.
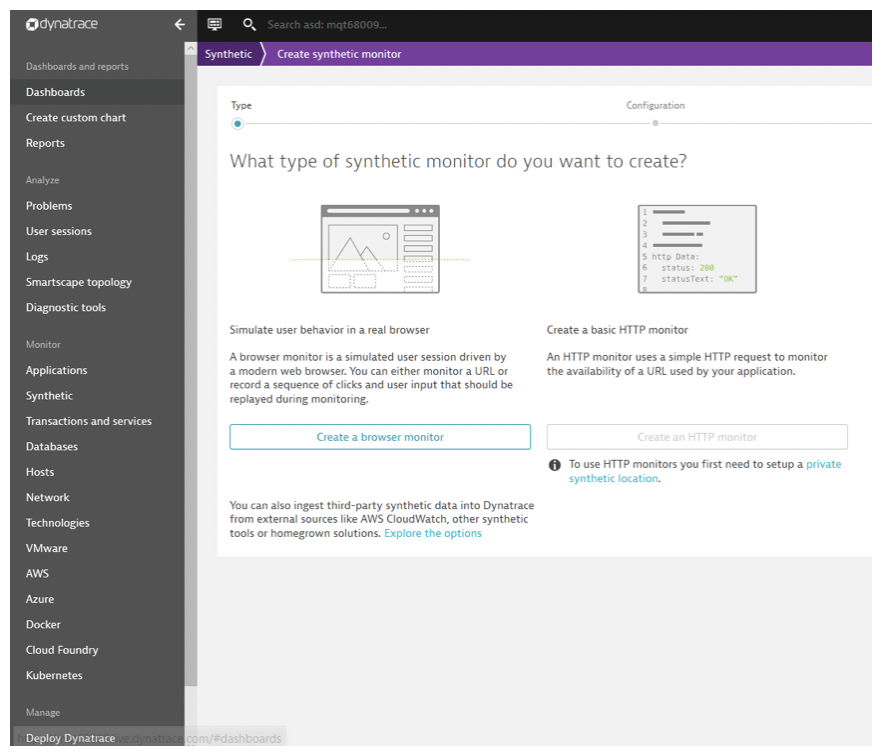
Step 1: Click on Create a browser monitor.
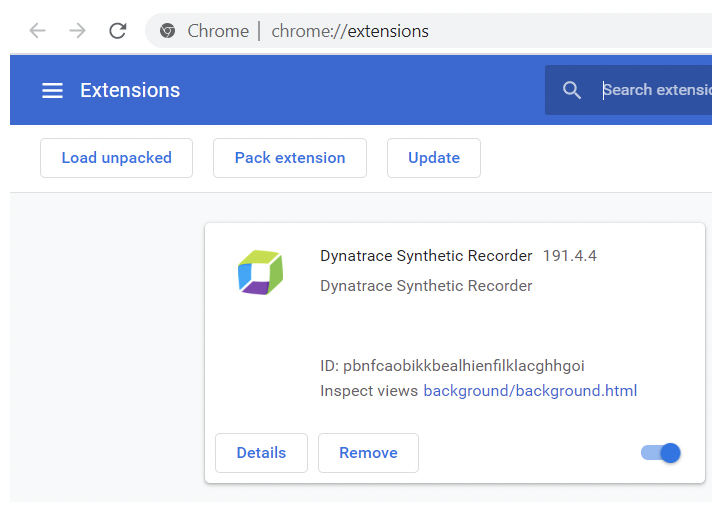
Step 2: Install the Dynatrace Synthetic Recorder Chrome extension. This extension will help us in recording the click paths easily.
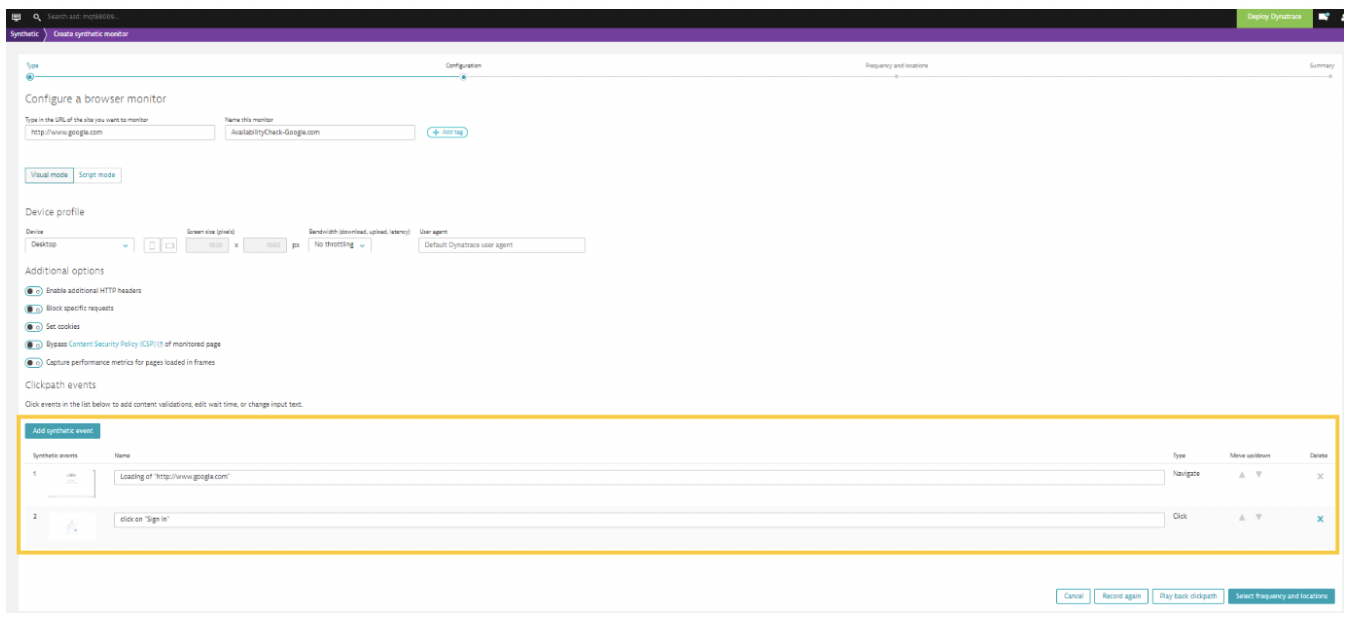
Step 3: In the next step we provide a name for the monitor and the URL for the application or an endpoint that we plan to monitor.
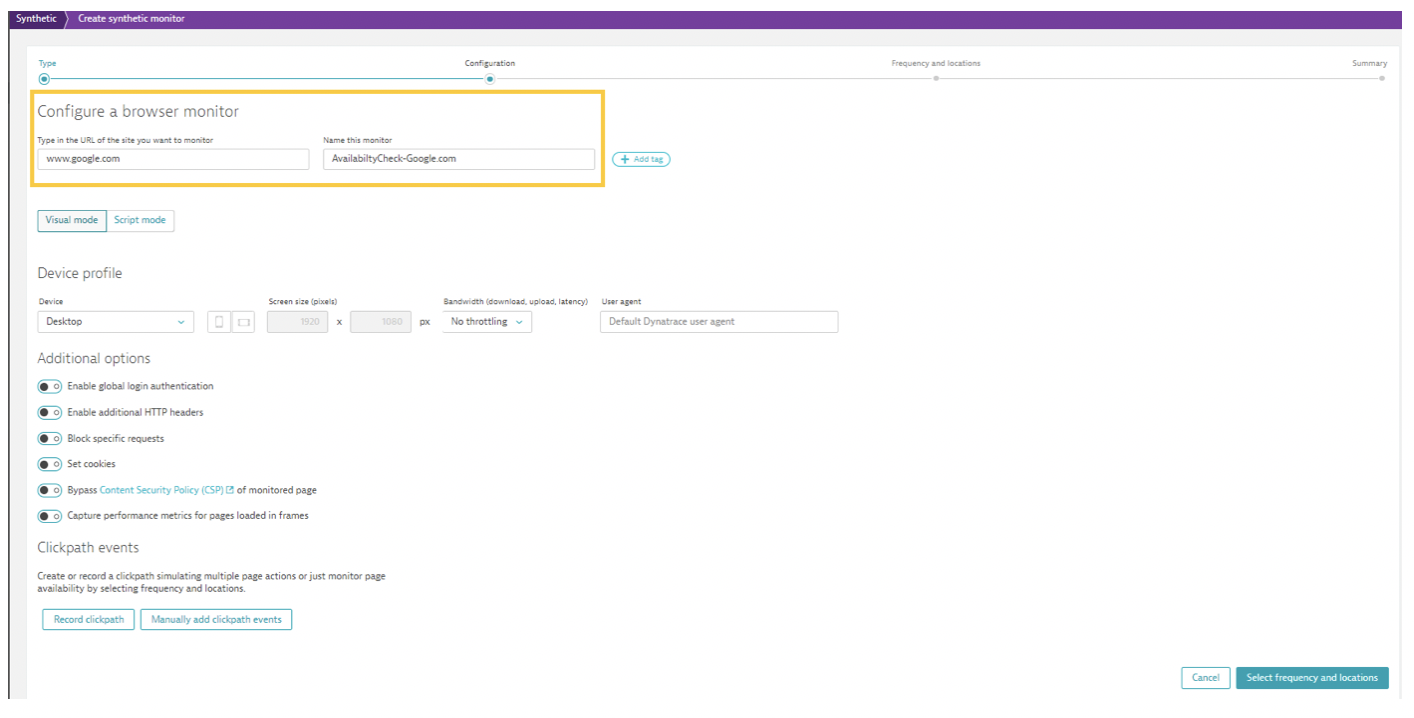
Step 4: Click on the Record Click path option so that Dynatrace Synthetic recorder will start recording the actions performed by us. In the record browser instance that pops up, perform the necessary actions to simulate a use case as per the requirement.
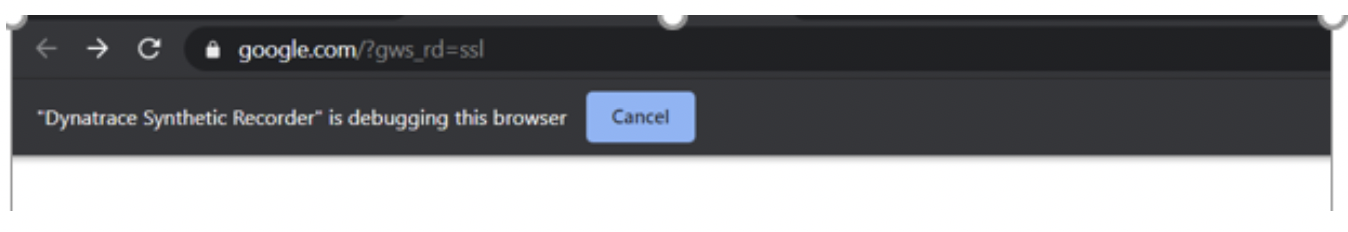
After performing the necessary actions click on the Cancel option.
Events in the recorded click path will be displayed.
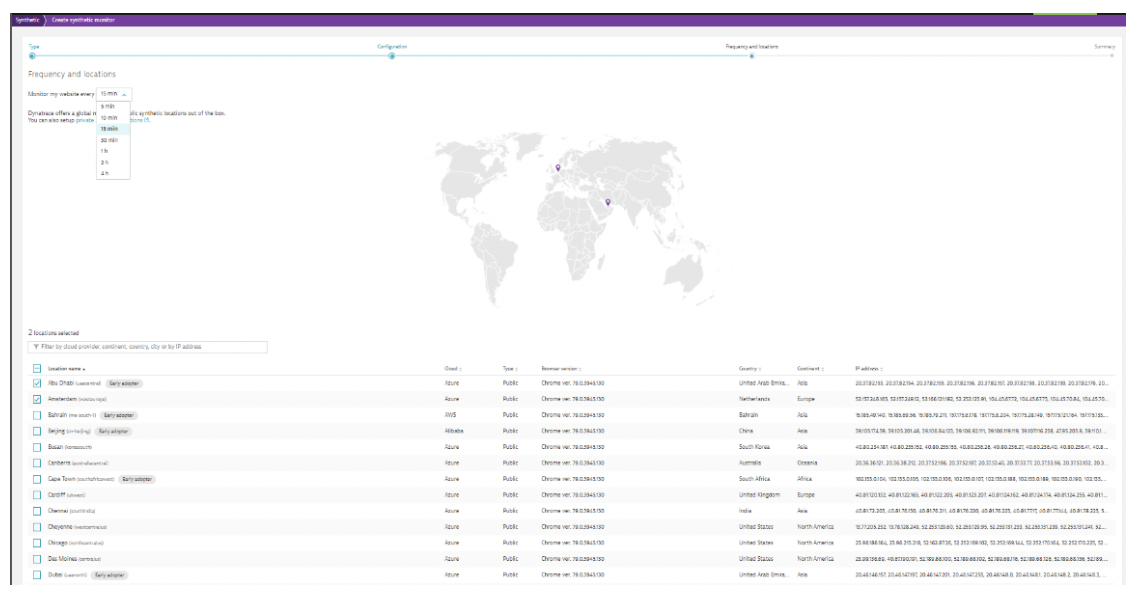
Step 5: The next step is selecting the frequency and the locations.]
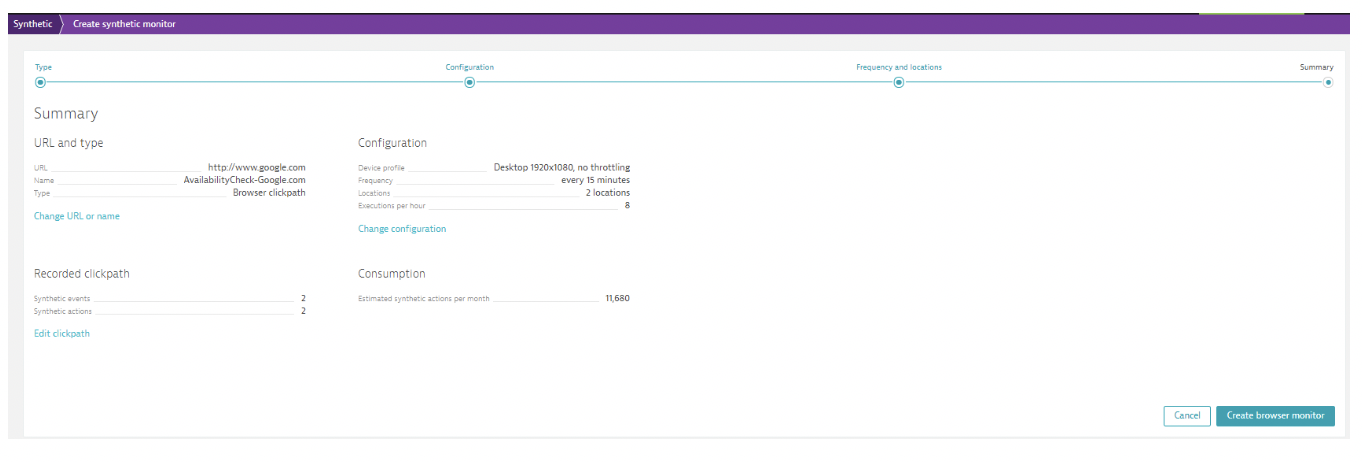
Step 6: The Summary Screen will provide the details of the monitor and you can perform a review before creating it.
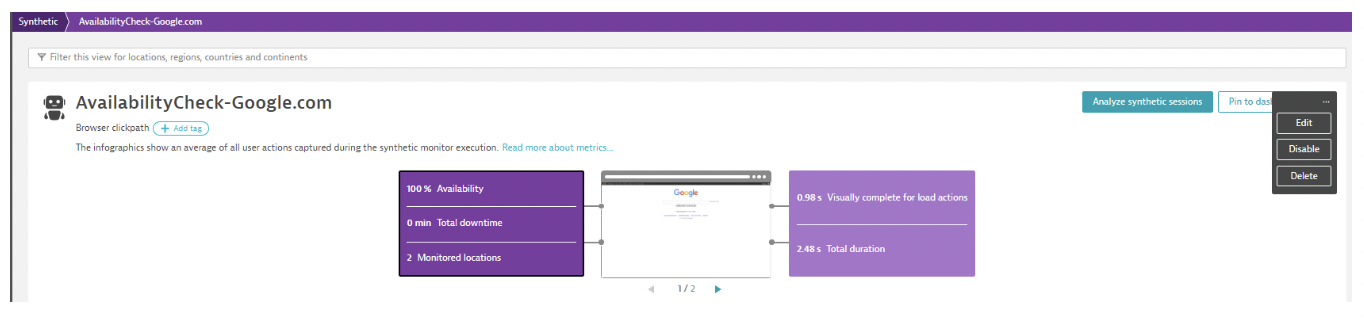
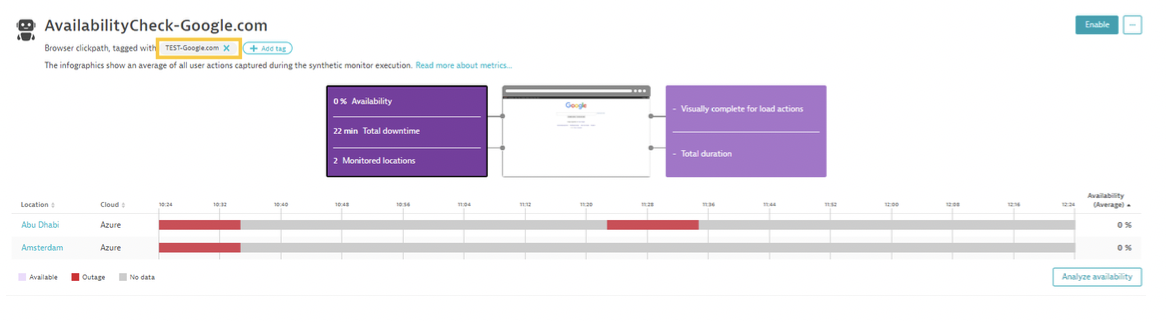
After a few minutes, you can see the monitoring data for the monitor.
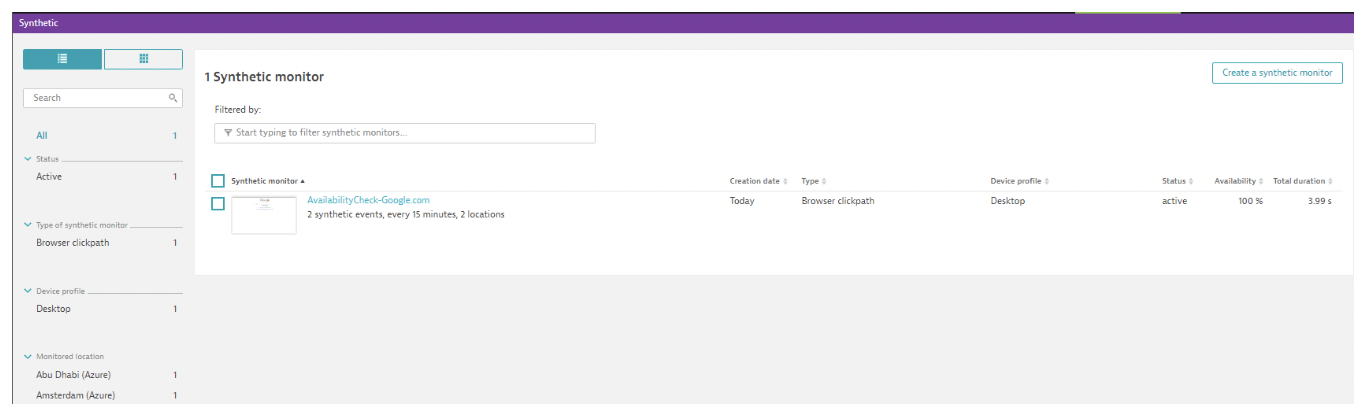
For more details on how the application is performing click on the monitor.
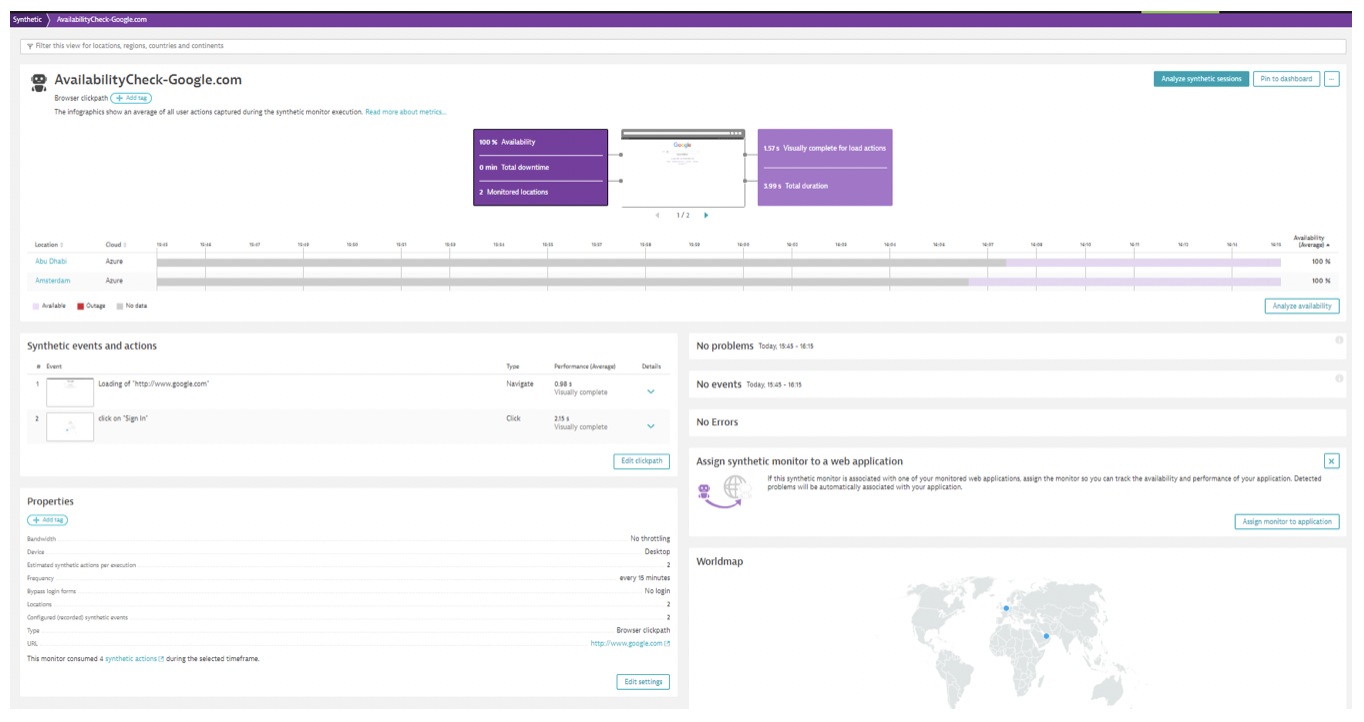
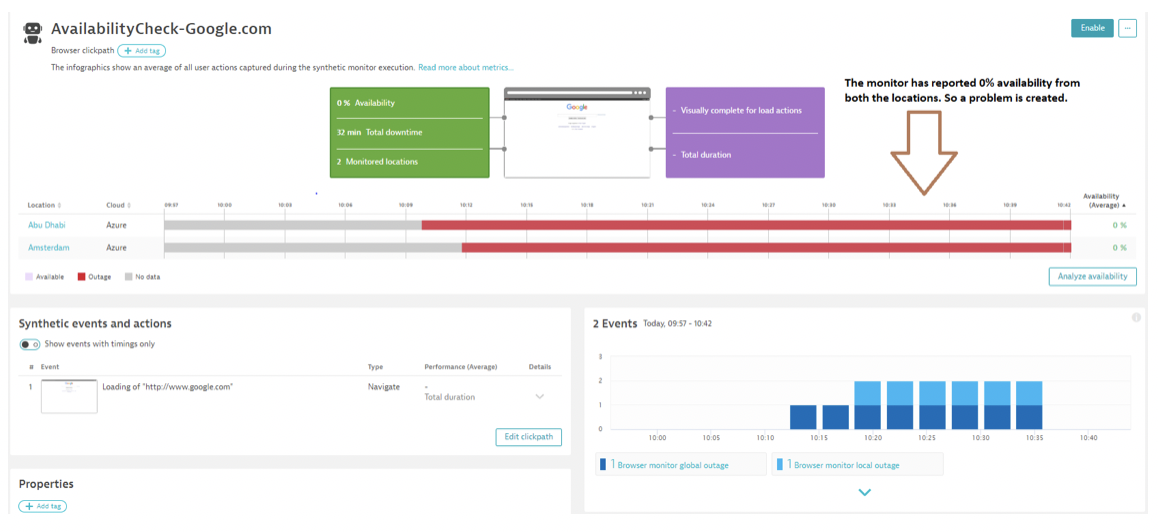
Click on Analyze Availability.
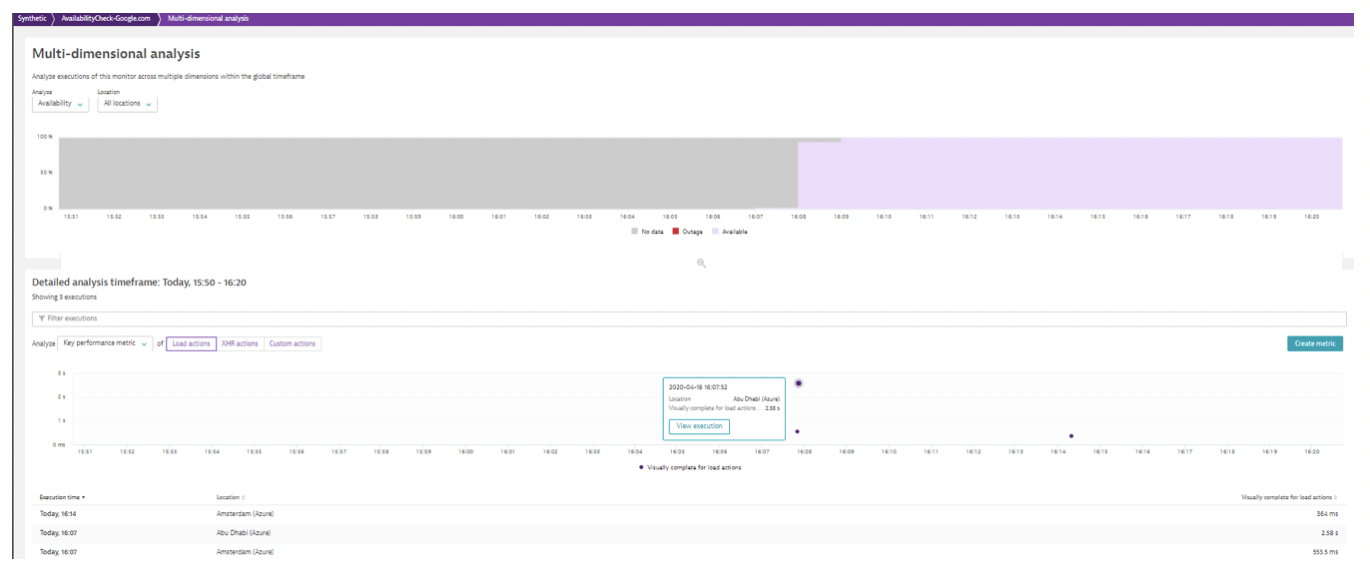
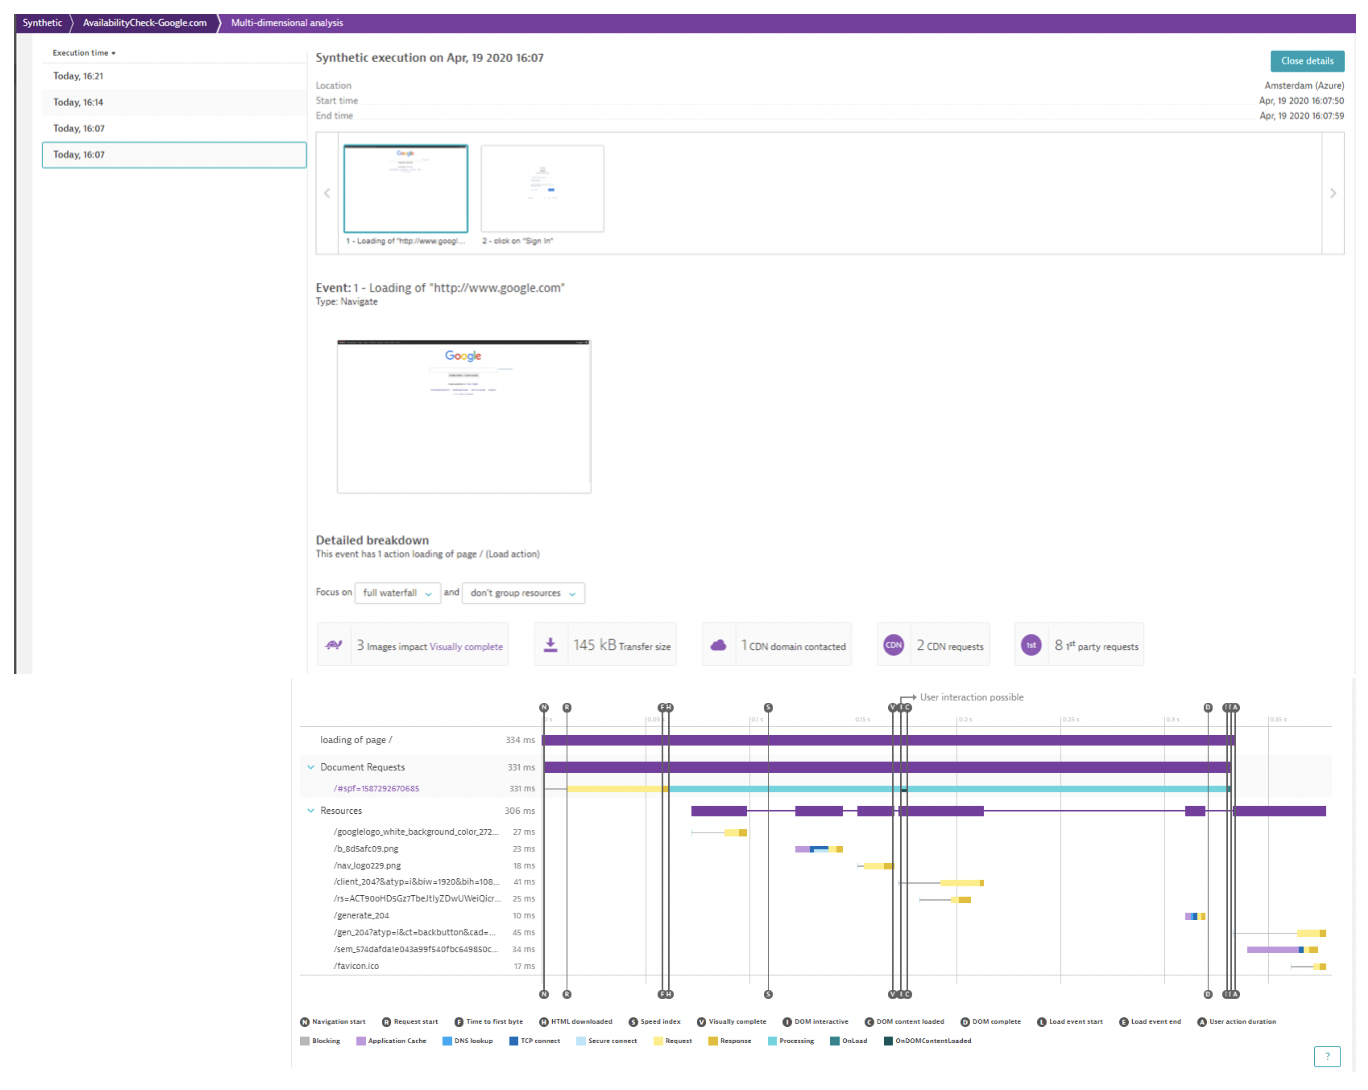
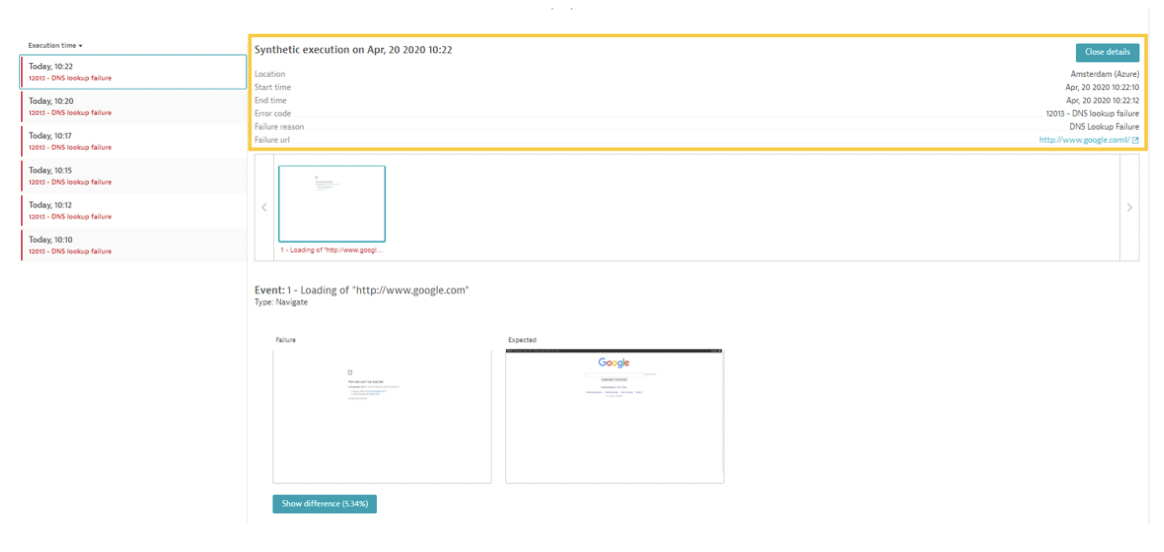
To analyze a specific run, click on a location and you can drill down on the details.
There is an option to enable/disable/delete/edit a monitor by clicking on the 3 dots available at the top.
Synthetic Alerting Process
Dynatrace can create Problems and send alerts whenever a monitor fails due to availability or performance issues because of the thresholds that we set. The thresholds for the monitors are specified in the monitor settings.
Availability
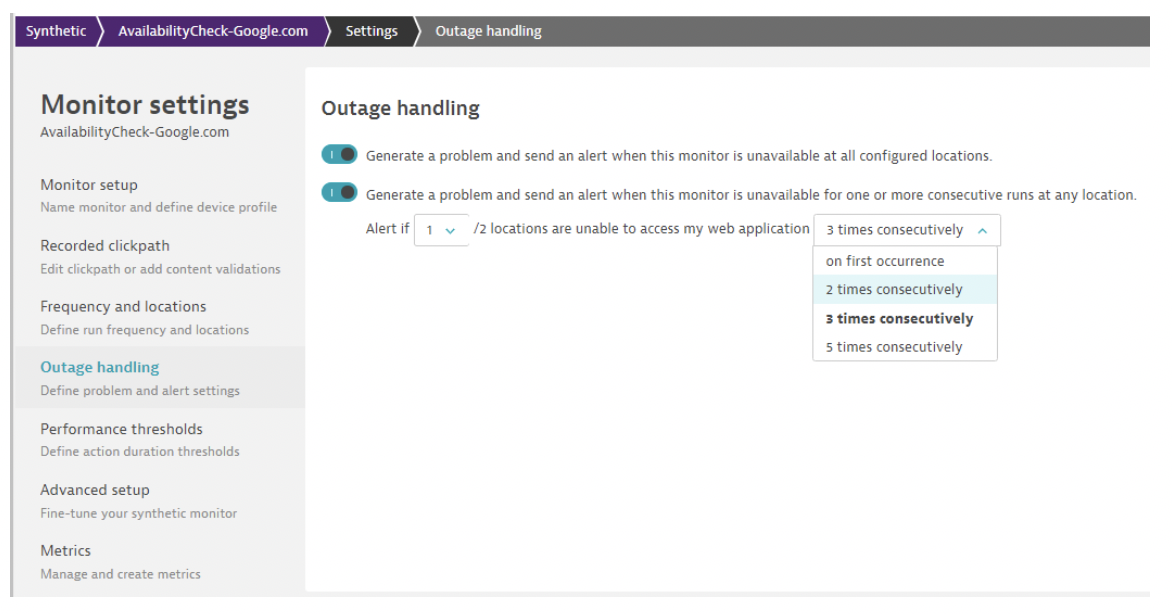
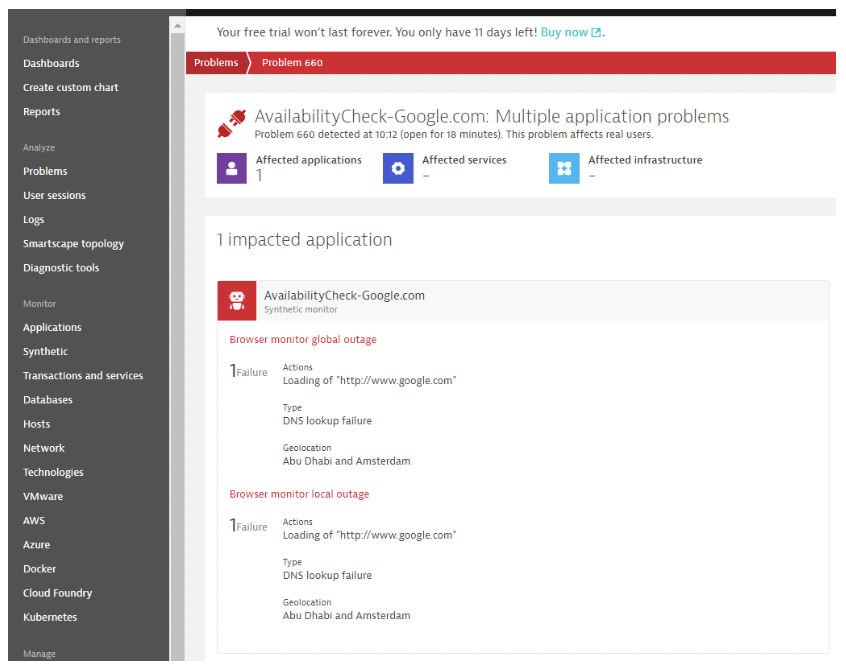
A local problem is created when the monitor is unavailable for one or more consecutive runs at any location.
A global problem is created when all the monitored locations are unavailable.
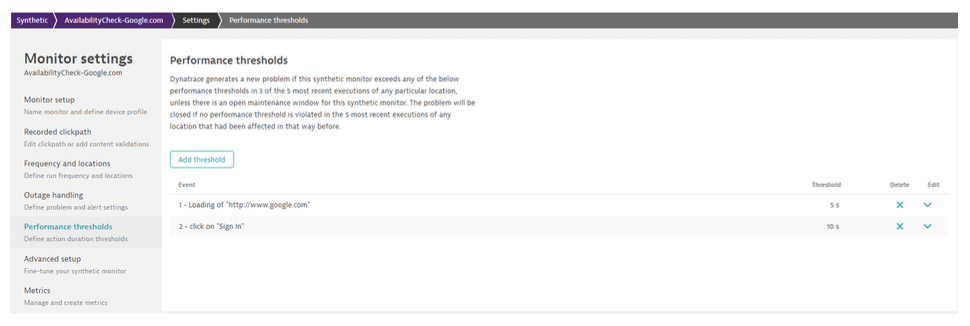
Performance
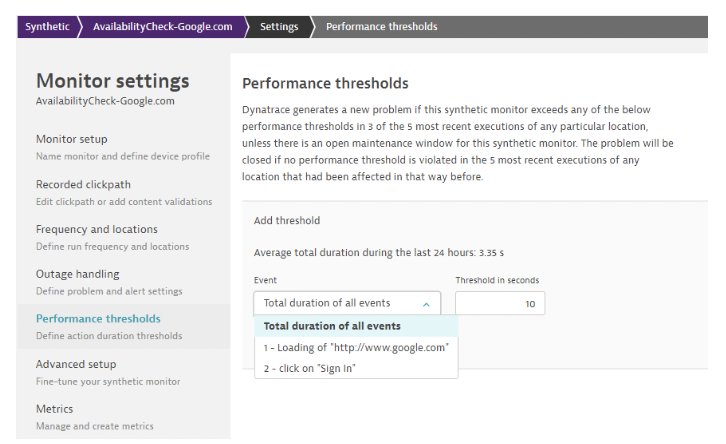
For example if we expect the 1st event which is Loading of the page http://www.google.com to complete in less than 5 seconds then we can set the threshold accordingly. A problem is created when any location exceeds the threshold configured.
Problems
A problem is created when a monitor violates the thresholds. To identify the list of Active Problems, click on the Problems section.
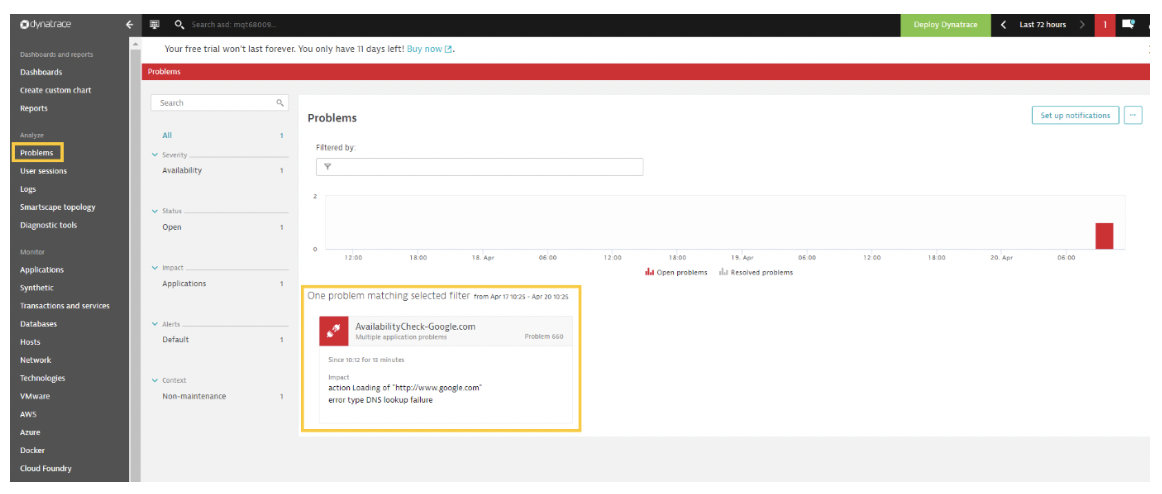
For example, there is an ongoing Problem for a monitor. For more details on the failure click on the Problem.
Click on Analyze availability to get more details on the reason for failure. We see that http://www.google.com1 is not a valid URL. So Dynatrace has reported a DNS Lookup Failure Error. Please note that the URL was modified to report a failure.
Dynatrace Email Notification
Dynatrace allows you to integrate with multiple third-party systems such as email for sending notifications when a Problem is created. Let’s understand the process of doing this setup.
Navigate to Settings > Integrations > Problem notifications > Set up notifications
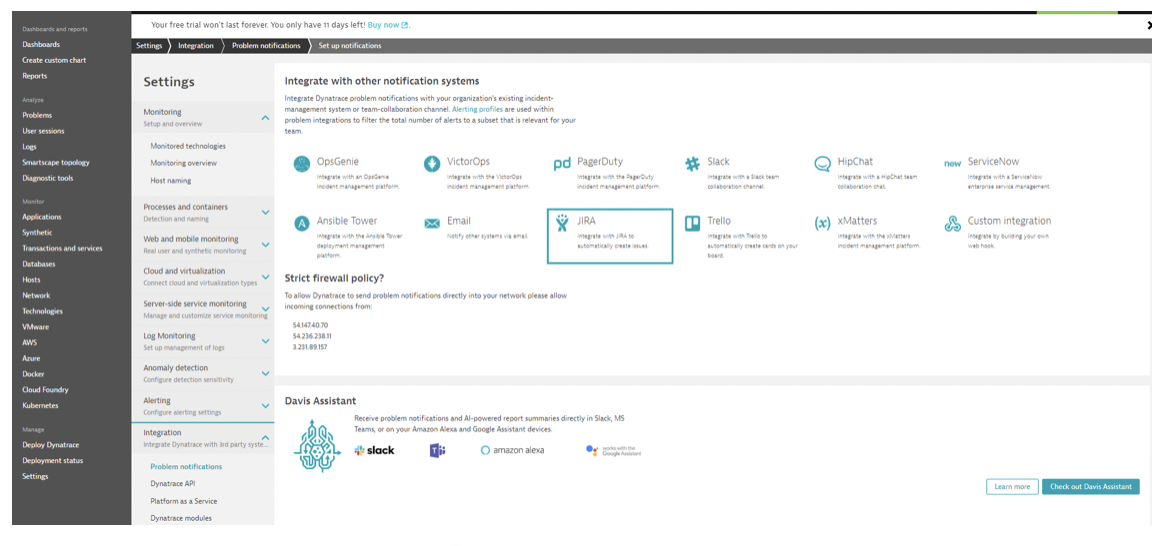
Click on Email.
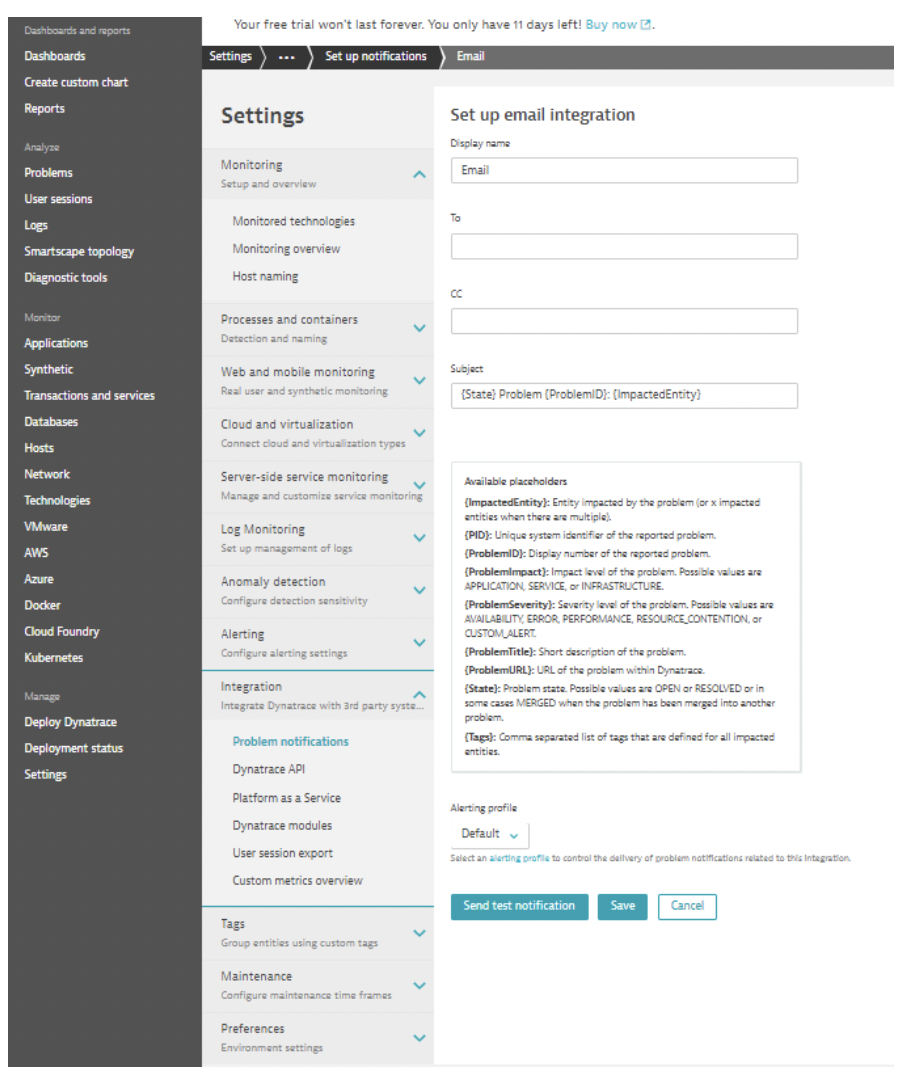
Provide the recipients for the alerts.
Alerting Profile allows you to control exactly which metrics can result in Problem Creation.
Navigate to Settings > Alerting > Alerting Profiles
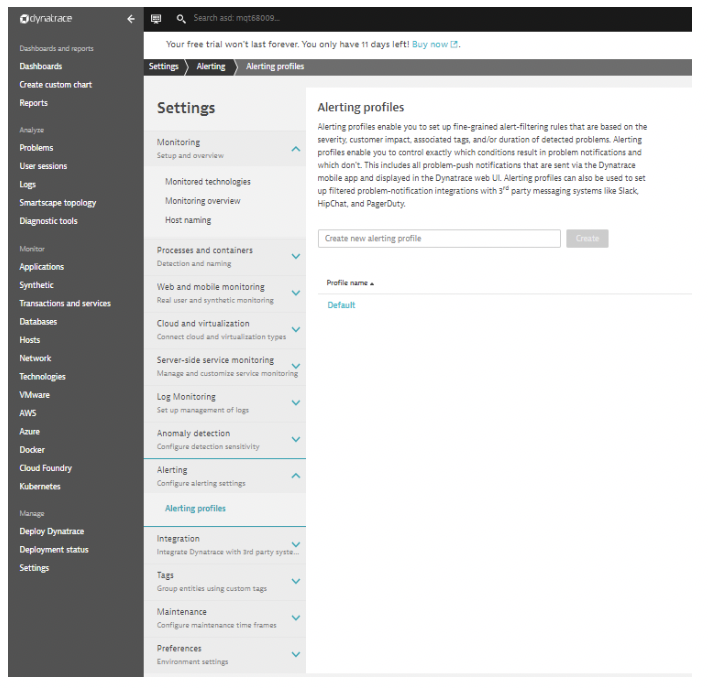
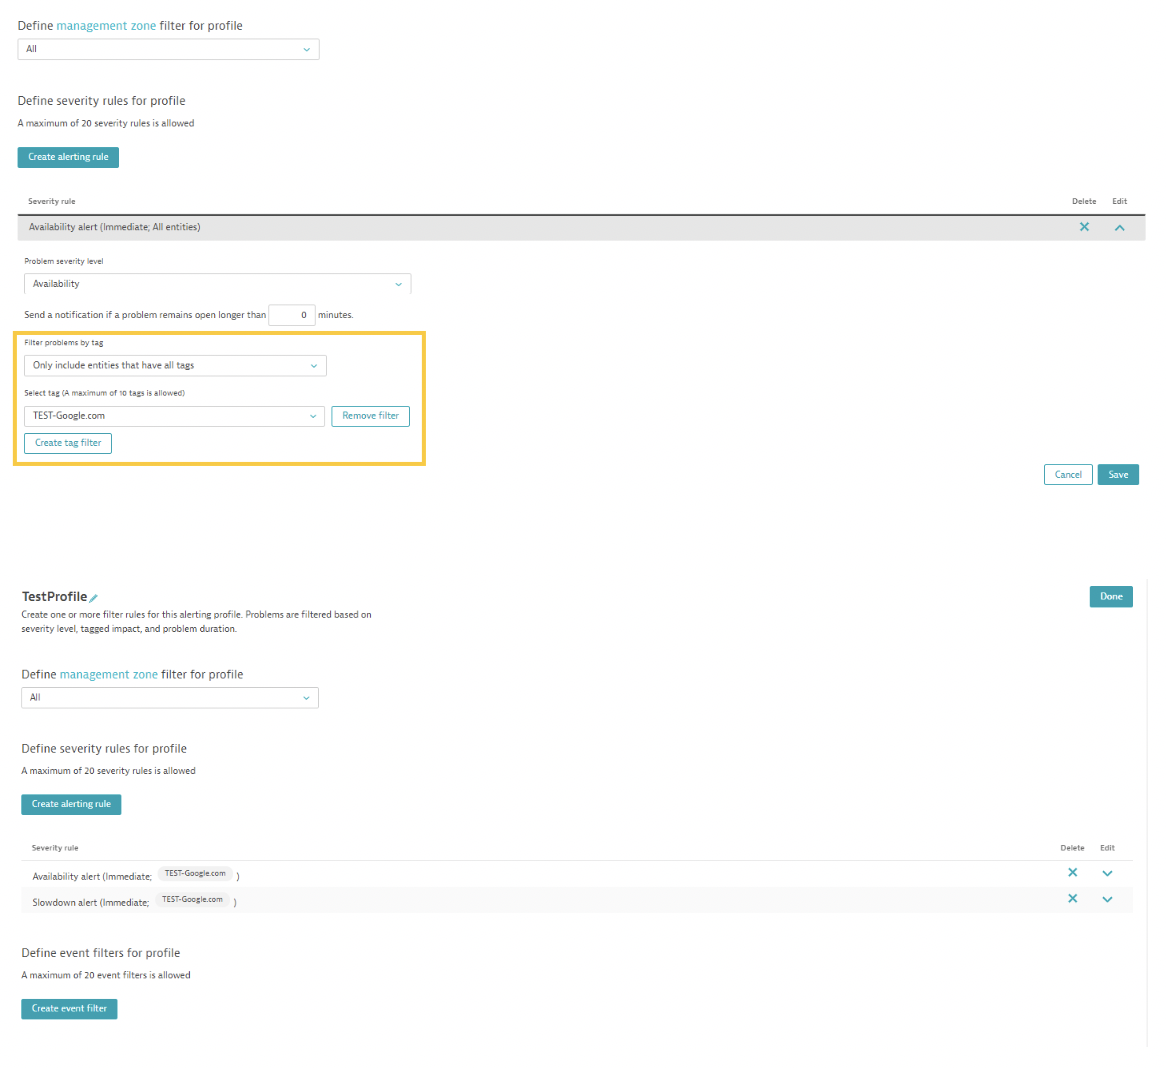
Let’s create a Profile with the name TestProfile. By default, the profile will be created with the below settings.
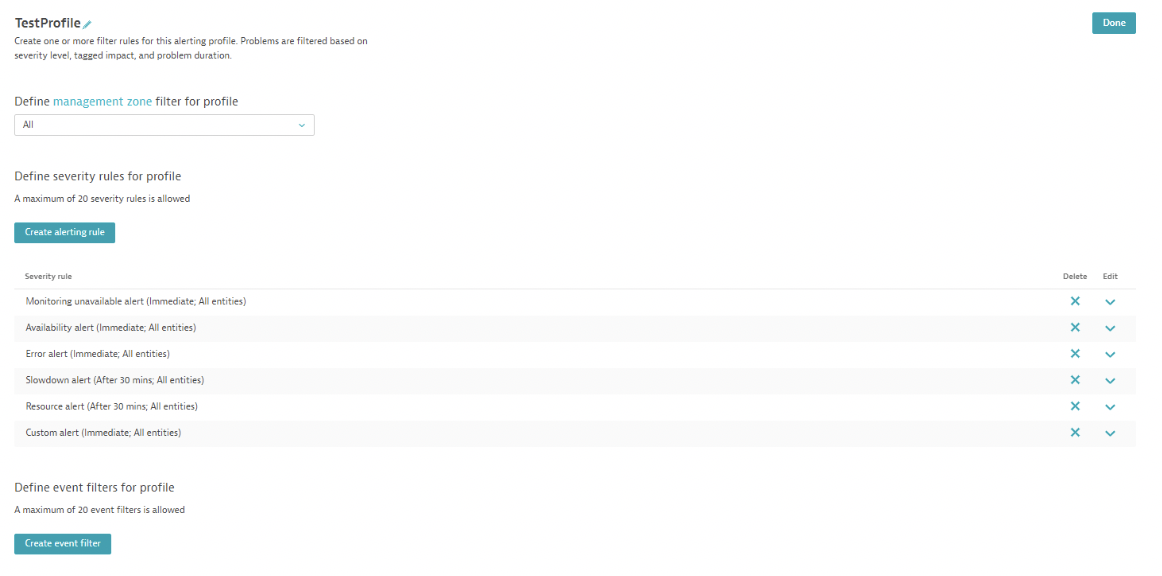
The setting can be modified based on current requirements.
By default, the system alerting rules trigger notifications immediately for availability and after 30 minutes for slowdown performance problems.
Availability and Slowdown are the metrics that pertain to Synthetic Monitoring.
We can adjust the recipient configuration using these settings available in the Alerting Profile. For example, you can notify or escalate an issue if a Problem remains open for a longer duration.
To ensure this alerting profile is associated to a single monitor, create a Tag, and associate the alerting Profile accordingly.
For example, I created a Tag for the monitor. TEST-Google.com is the tag name.
Now in the Alerting Profile Section I can filter the monitor based on the Tags. So Dynatrace will apply this rule only for this specific Monitor.
After we associate the Tag to the alerting profile the next step is to associate the Email Integration setup with the Alerting Profile.
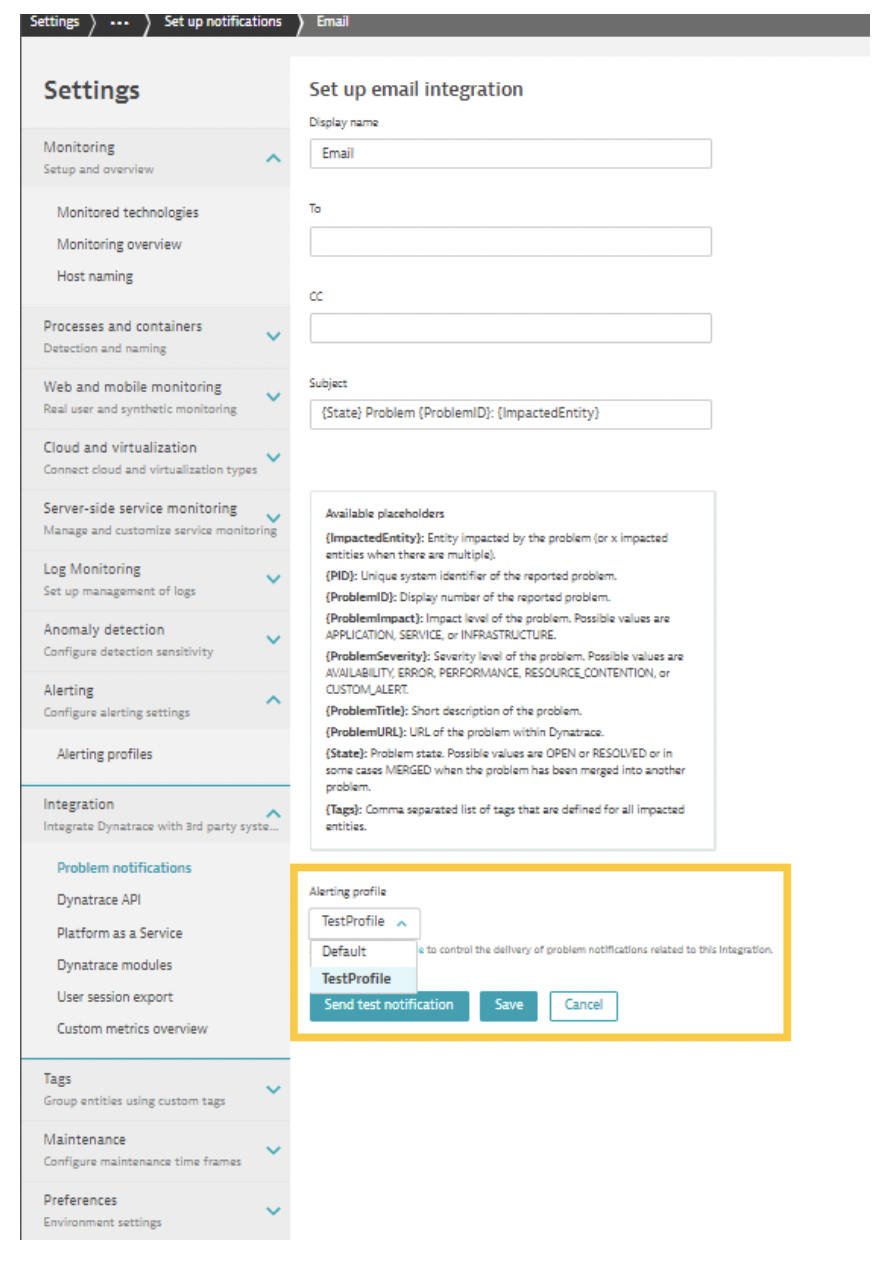
After the TestProfile is selected click on Send test notification.
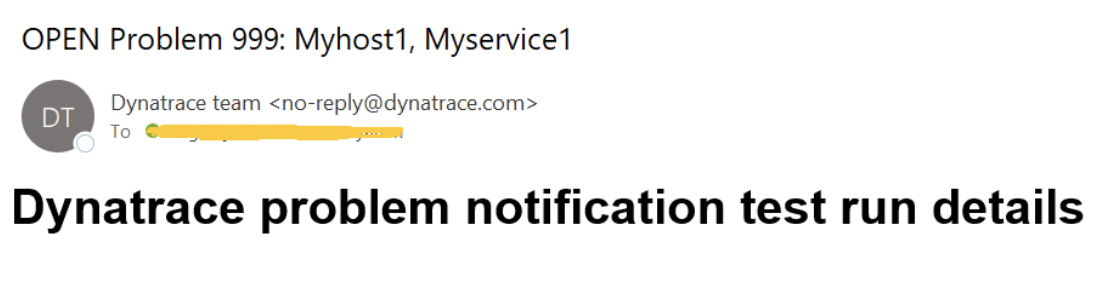
Dynatrace will trigger a test notification email to the recipients.
So, in this blog we have seen how Dynatrace Browser monitors can help identify problems and determine if a website is experiencing slowness or downtime before the problem impacts end-users or customers. It helps monitor critical business flows and helps Applications teams take necessary proactive action.
I hope you found this interesting. Thank you for reading!