


A Single Place to Manage, Create, and Consume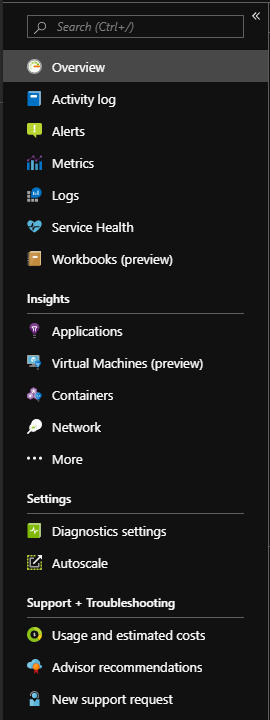
The integration of the Operations Management Suite (OMS) into Azure Monitor is completed for both Azure Commercial and Azure Government. This change by Microsoft has given Azure Monitor/OMS users a single place to manage, create, and consume Azure Monitoring solutions. No functionality has been removed and documentation has been consolidated under the Azure Monitor documentation. With this consolidation of services, there have been some terminology changes that will impact the way one talks about Azure Monitor components. The consolidation of OMS and other Azure services into Azure Monitor is simplifying the way you manage the monitoring of your Azure services.
Updated Terminology
Microsoft has updated some of the terminologies for the Azure Monitor components to reflect the transition from OMS. I have highlighted some examples:
- The log data for Azure Monitor is still stored in a Log Analytics Workspace, but the term Log Analytics in the Microsoft documentation is now Azure Monitor Logs.
- The term log analytics now applies to the page in the Azure portal used to write and run queries and analyze log data.
- What was once known as OMS Management solutions have been renamed Monitoring solutions (items like Security & Compliance and Automation & Control)
Azure Monitor — Your 1 Stop “Monitoring & Alerting” Shop
Azure Monitor is now pretty much the one stop shop for your monitoring and alerting needs (the exception here would be Azure Security Center is still the place to go to for most of your security and compliance needs).
Azure Monitor is broken out into four main categories in the Azure Portal:
- The main components of Azure monitor
- Insights
- Settings
- Support + Troubleshooting.
The main components include the Activity log, Alerts, Metrics, Logs, Service Health, and Workbooks.
Under Insights, there is Application, Virtual Machines, Containers, Network, and “…More”.
The Settings category includes Diagnostics settings and Autoscale.
And finally, under Support + Troubleshooting, there is Usage & estimated costs, Advisor recommendations, and New support request.
Check out the below table that provides an overview of the Azure Monitor Components and Descriptions:
| Azure Monitor Component | Description |
| Overview | Overview of Azure Monitor |
| Activity Log | Log data about the operations performed in Azure |
| Alerts | Notifications based on conditions that are found in monitoring data both metrics and logs |
| Metrics (Metrics Explorer) | Plotting charts, visually correlating trends, and investigating spikes and dips in metrics’ values. |
| Logs (Azure Monitor Logs) | Useful for performing complex analysis across data from a variety of sources |
| Service Health | Provides a personalized view of the health of the Azure services and regions you’re using |
| Workbooks | Combine text, Analytics queries, Azure Metrics, and parameters into rich interactive reports. |
| Applications | Application Performance Management service for web developers |
| Virtual Machines | Analyzes the performance and health of your Windows and Linux VMs and monitors their processes and dependencies on other resources and external processes. |
| Containers | Monitor the performance of container workloads deployed to either Azure Container Instances or managed Kubernetes clusters hosted on Azure Kubernetes Service (AKS). |
| Network | Tools to monitor, diagnose, view metrics, and enable or disable logs for resources in an Azure virtual network. |
| More | Replacement for the OMS Portal Dashboard. |
| Diagnostic Settings | Configure the diagnostic setting for Azure resources (formally known as Diagnostic Logs) |
| Autoscale | Consolidated view of Azure resources that have Autoscale enabled |
| Usage and estimated costs | Consumption and cost estimates of Azure Monitor |
| Advisor Recommendations | Link to Azure Advisor |
| New support requests | Create a support request |