


 As more and more businesses move their applications to the cloud, it’s clear that operation and log data analysis is a major component to the migrating process. That data is crucial to understanding the health and reliability of your cloud services with respect to scalability, resilience, uptime, and your ability to troubleshoot issues.
But how do you deal with all that operational data? How do you identify specific application issues such as exceptions raised from bugs in the code, troubling increases in processor or memory consumption, or slow response times?
It turns out that migrating your applications to the cloud is just the first step: Having a well-thought-out operational data and monitoring user story is just as important.
The Problem
I recently supported an enterprise customer who decided to move their application to Azure Cloud. Their IT and architecture departments baselined the application architecture into multiple cloud services: web front end, database back end, and the business tier to host the REST services and external services such as payment, billing, and credit.
For the initial rollout, we provisioned six instances for the web front end, one instance for database services, and six instances for the middle-tier services. Since they are running on the Microsoft Windows platform, each cloud service instance has event data generated by custom application logging, the operating system, and security. With that, we’re looking at multiple sources of operations data (machine data) per instance multiplied by the total number of instances. Roughly speaking, our customer will have 38 total logging sources:
| Type of service | # of instances | # of logging sources (event viewer-operating system/metrics, security, custom app logging, etc.) | Total log data feeds |
| Web front end | 6 | 3 | 18 |
| Database | 1 | 2 | 2 |
| Middle Tier | 6 | 3 | 18 |
| 38 total logging sources |
That’s a lot of logging information just for migrating one application to the cloud!
As you can tell by the above scenario (which is very typical for big companies), a good solution is to aggregate your log data to some centralized location. It would be far too time consuming to log in remotely to each and every instance for troubleshooting. For example, the Internal Load Balancer implementation in Azure uses a hash-based distribution algorithm, which makes pinpointing the offending instance difficult (How Azure ILB works). Many companies implement security protocols against authorized remote access to cloud instances as well.
For this blog, we’ll look at a product licensed by my enterprise customer, and I’ll show you how some of its features allowed me and my team to easily identify issues in their cloud services.
Our Solution
Since our customer already had licensing for Splunk, it made sense to learn more about this product for our data aggregation needs. Splunk is an application that allows you to look at aggregated machine data (logging/metrics) and provide operational intelligence by turning that machine data into valuable insights from customer usage of your applications.

Fig. 1. Courtesy of splunk.com
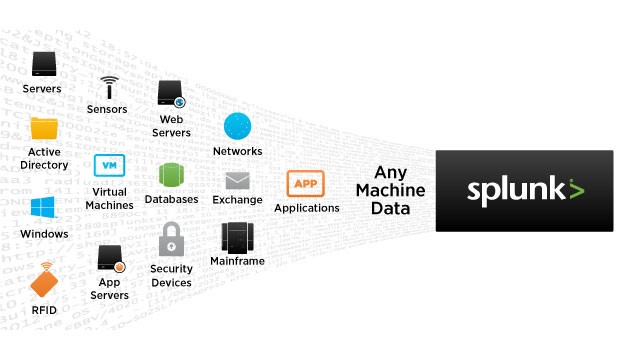
Fig. 2. Courtesy of splunk.com
Splunk has many features, but my experience focused on three: search/investigation, reports, and alerting. Our customer implemented Splunk on-prem, with cloud instances using the Splunk forwarders to “forward” logging information (Windows Event Viewer, WMI, custom application logging, azure logging, etc.) to a centralized Splunk server. By creating indexes based on the type of source (application, IIS, event data, Azure, metrics, cloud service name), I can query the system (search and investigate) to discover when and from where an exception or issue occurred. I’ve been able to pinpoint an issue, sometimes within minutes, while using Splunk’s powerful querying capabilities.
Search & Investigation
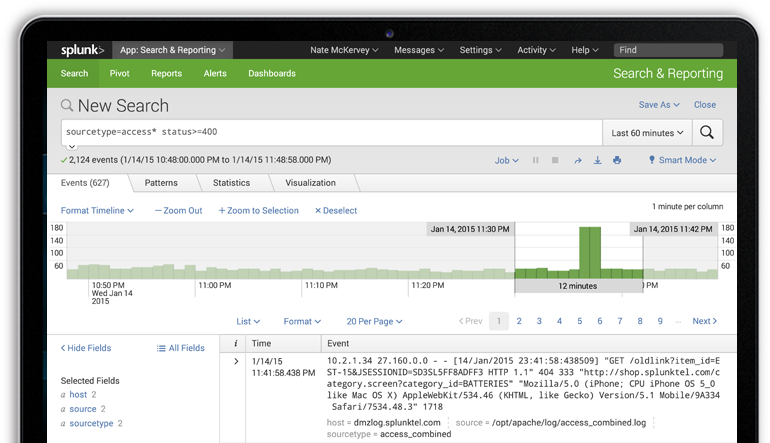
Fig. 3. Courtesy of splunk.com – Search/investigating
For example, on day one of going live, the client’s anxiety of moving their application from on-prem to the cloud slowly dissipated as reports from upper management showed the number of successful clients buying their products. But then it happened: some clients’ requests were failing!
We immediately ran our queries against the aggregated data, and after 15 minutes, we determined that some SSL certificates were invalid due to certificate revocation servers being inaccessible from the middle tier. We were able to query against the IIS log’s source type and identify 403.13 http status codes on several of the middle-tier instances. Since this log data was aggregated, we saved a lot of time by not having to remote desktop into all six instances of the middle tier.
Reporting
But sometimes issues are hidden and don’t produce anything meaningful in the logs—unless you’re looking for them. This is where daily reporting can help. Custom dashboards can be created in Splunk to graphically show trends and characteristics for any type of business, operational, or security requirement.
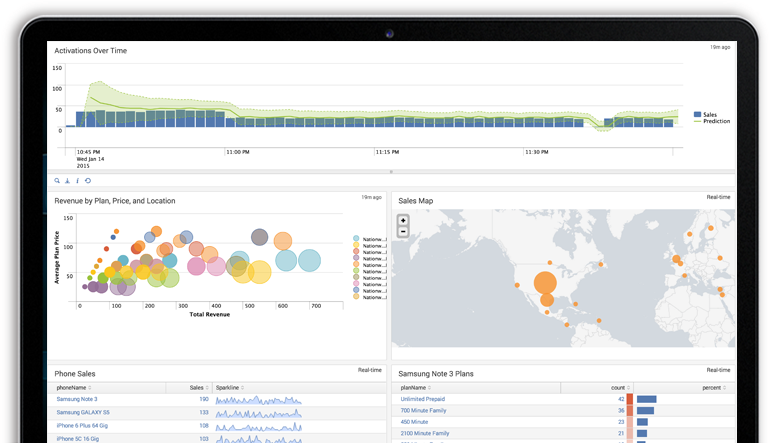
Fig. 4. Courtesy of splunk.com
It was in such a report that our team identified some long-running processes that would intermittently cause http 500 errors, inevitably causing the request to time out. Prior to going live, we created reports for exceptions thrown in the application and http response code counts, and determined where they came from (specific cloud instances). Here’s an example of a typical report query that identifies IIS errors (IIS log data source type):
{index} sc_status >= 400 | table _time, cloudServiceName, cs_method, normalized_uri, roleInstanceId, sc_status, time_taken
The following report shows well-known http error codes per cloud service role instance (cloud service role instance blurred) and the count of each.
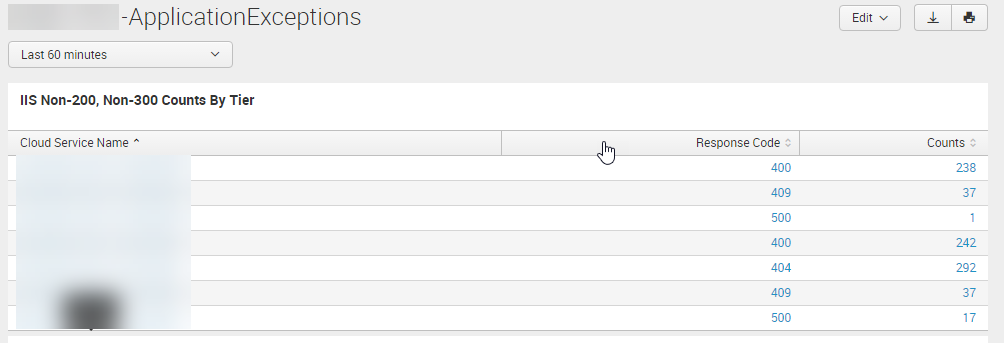
Again, by having the log data aggregated to a central store, identifying issues became quick work.
Alerting
Finally, you can turn any query or search into real-time alerts. You can have these alerts automatically send out emails, trigger other alerts or queries, or create call tickets to your DevOps team. Using scheduled cron jobs, you may want to be alerted to any SQL database exceptions based on the exception count. Since our customer’s application relies heavily on database operations, an alert was created in the event that the SQL Server throws a DatabaseSqlException in excess of 40 times within the alert time frame:
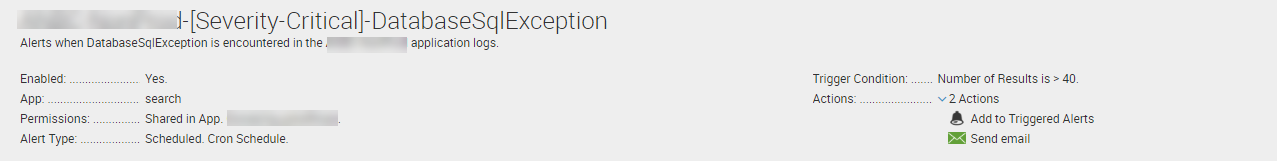
Since this is a scheduled alert, querying the log data every five minutes, you’ll notice that an email will be sent to the customer’s DevOps team when the trigger condition is met.
Conclusion & Alternatives
Moving your applications to the cloud has many benefits, but it also has some drawbacks, particularly in how to analyze and deal with the over-abundance of machine-generated data. This is big data, and with the advent of the Internet of Things, there will be so much more of it. Architecting a good story around managing your operational data can save hours of frustration with your cloud services should (and when) issues arise, as well as provide your company with opportunities to improve and predict trends. With our customer, it has been proven time and time again just how important this aspect of cloud services migration has become.
There are many alternatives Splunk for organizing, collecting, and aggregating your operational data. Cost and whether it is a standalone or cloud-based service or application are some reasons to consider something different. Here are a few examples: