


This blog is a follow on about Azure Cognitive Services, Microsoft’s offering for enabling artificial intelligence (AI) applications in daily life. The offering is a collection of AI services with capabilities around speech, vision, search, language, and decision.
In Azure Cognitive Services Personalizer: Part One, we discussed the core concepts and architecture of Azure Personalizer Service, Feature Engineering, its relevance, and its importance.
In this blog, Part Two, we will go over a couple of use cases in which Azure Personalizer Service is implemented. We will look at features used, reward calculation, and their test run result. Stay tuned for Part Three, where we will list out recommendations and capacities for implementing solutions using Azure Personalizer Service.
Use Cases and Results
Two use cases implemented using Personalizer involves the ranking of content for each user of a business application.
Use Case 1: Dropdown Options
Different users of an application with manager privileges would see a list of reports that they can run. Before Personalizer was implemented, the list of dozens of reports was displayed in alphabetical order, requiring most of the managers to scroll through the lengthy list to find the report they needed. This created a poor user experience for daily users of the reporting system, making for a good use case for Personalizer. The tooling learned from the user behavior and began to rank frequently run reports on the top of the dropdown list. Frequently run reports would be different for different users, and would change over time for each manager as they get assigned to different projects. This is exactly the situation where Personalizer’s reward score-based learning models come into play.
Context Features
In our use case of dropdown options, the context features JSON is as below with sample data
{
    "contextFeatures": [
        {
            "user": {
                "id":"user-2"
            }
        },
        {
            "scenario": {
                "type": "Report",
                "name": "SummaryReport",
                "day": "weekend",
                "timezone": "est"
            }
        },
        {
            "device": {
                "mobile":false,
                "Windows":true,
                "screensize": [1680,1050]
            }
        }
    ]
}
Actions (Items) Features
Actions were defined as the following JSON object (with sample data) for this use case
{
    "actions": [
    {
        "id": "Project-1",
        "features": [
          {
              "clientName": "Client-1",
              "projectManagerName": "Manager-2"
          },
          {

                "userLastLoggedDaysAgo": 5
          },
          {
              "billable": true,
              "common": false
          }
        ]
    },
    {
         "id": "Project-2",
         "features": [
          {
              "clientName": "Client-2",
              "projectManagerName": "Manager-1"
          },
          {

              "userLastLoggedDaysAgo": 3
           },
           {
              "billable": true,
              "common": true
           }
        ]
    }
  ]
}
Reward Score Calculation
Reward score was calculated based on the actual report selected (from the dropdown list) by the user from the ranked list of reports displayed with the following calculation:
- If the user selected the 1st report from the ranked list, then reward score of 1
- If the user selected the 2nd report from the ranked list, then reward score of 0.5
- If the user selected the 3rd report from the ranked list, then reward score of 0
- If the user selected the 4th report from the ranked list, then reward score of – 0.5
- If the user selected the 5th report or above from the ranked list, then reward score of -1
Results
View of the alphabetically ordered report names in the dropdown before personalization:
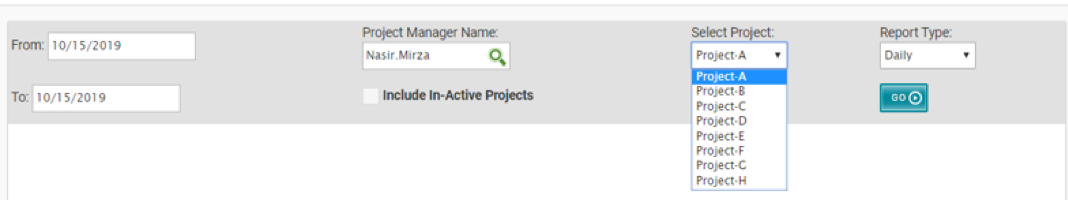
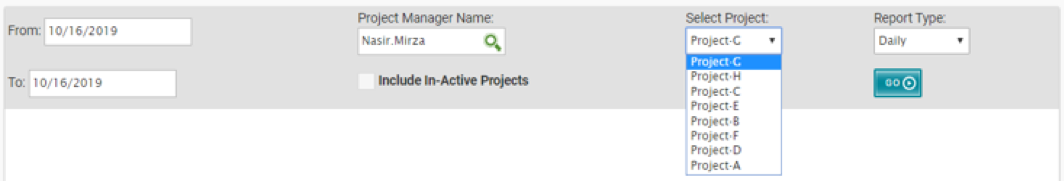
View of the Personalizer ranked report names in the dropdown for the given user:
Use Case 2: Projects in Timesheet
Every employee in the company logs a daily timesheet listing all of the projects the user is assigned to. It also lists other projects, such as overhead. Depending upon the employee project allocations, his or her timesheet table could have few to a couple of dozen active projects listed. Even though the employee is assigned to several projects, particularly at lead and manager levels, they don’t log time in more than 2 to 3 projects for a few weeks to months.
Before personalization, the projects in the timesheet table were listed in alphabetical order, again resulting in a poor user experience. Even more troublesome, frequent user errors caused the accidental logging of time in the incorrect row. Personalizer was a good fit for this use case as well, allowing the system to rank projects in the timesheet table based on time logging patterns for each user.
Context Features
For the Timesheet use case, context features JSON object is defined as below (with sample data):
{
    "contextFeatures": [
        {
            "user": {
                "loginid":"user-1",
                "managerid":"manager-1"

            }
        },
        {
            "scenario": {
                "type": "Timesheet",
                "day": "weekday",
                "timezone": "ist"
            }
        },
        {
            "device": {
                "mobile":true,
                "Windows":true,
                "screensize": [1680,1050]
            }
        }
     ]
}
Actions (Items) Features
For the timesheet use case, the Actions JSON object structure (with sample data) is as under:
{
    "actions": [
    {
        "id": "Project-1",
        "features": [
          {
              "clientName": "Client-1",
              "userAssignedForWeeks": "4-8"
          },
          {

              "TimeLoggedOnProjectDaysAgo": 3
          },
          {
              "billable": true,
              "common": false
          }
        ]
    },
    {
         "id": "Project-2",
         "features": [
          {
              "clientName": "Client-2",
              "userAssignedForWeeks": "8-16"
          },
          {

              " TimeLoggedOnProjectDaysAgo": 2
           },
           {
              "billable": true,
              "common": true
           }
        ]
    }
  ]
}
Reward Score Calculation
The reward score for this use case was calculated based on the proximity between the ranking of projects in timesheet returned by the Personalizer and the actual projects that the user would log time as follows:
- Time logged in the 1st row of the ranked timesheet table, then reward score of 1
- Time logged in the 2nd row of the ranked timesheet table, then reward score of 0.6
- Time logged in the 3rd row of the ranked timesheet table, then reward score of 0.4
- Time logged in the 4th row of the ranked timesheet table, then reward score of 0.2
- Time logged in the 5th row of the ranked timesheet table, then reward score of 0
- Time logged in the 6th row of the ranked timesheet table, then reward score of -0.5
- Time logged in the 7th row or above of the ranked timesheet table, then reward score of -1
The above approach to reward score calculation considers that most of the time users would not need to fill out their timesheet for more than 5 projects at a given time. Hence, when a user logs time against multiple projects, the score can be added up and then capped between 1 to -1 while calling Personalizer Rewards API.
Results
View of the timesheet table having project names alphabetically ordered before personalization:
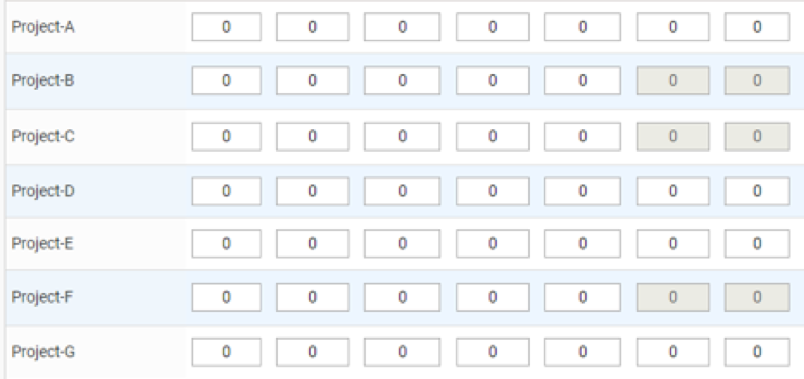
View of the timesheet table where project names are ordered based on ranking returned by Personalization Service:
Testing
In order to verify the results of implementing the Personalizer in our selected use cases, unit tests were effective. This method was helpful in two important aspects:
- Injecting the large number of user interactions (learning loops)
- In simulating the user behavior towards a specific pattern
This provided an easy way to verify how Personalizer reflects the current and changing trends injected via Unit Tests in the user behavior by using reward scores and exploration capability. This also enabled us to test different configuration settings provided by Personalizer Service.
Test Run 1
This 1st test run simulated different user choices with different explorations settings. The test results show the number of learning loops that started reflecting the user preference from intermittent to a consistent point.
Unit Test Scenario |
Learning Loops, Results and Exploration Setting |
| User selection of Project-A | Personalizer Service started ranking Project-A at the top intermittently after 10 – 20 learning loops and ranked it consistently at the top after 100 learning loops with exploration set to 0% |
| User selection of Project-B | Personalizer Service started reflecting the change in user preference (from Project-A to Project-B) by ranking Project-B at the top intermittently after 100 learning loops and ranked it consistently at the top after 1200 learning loops with exploration set to 0% |
| User selection of Project-C
|
Personalizer Service started reflecting the change in user preference (from Project-B to Project-C) by ranking Project-C at the top intermittently after 10 – 20 learning loops and ranked it almost consistently at the top after 150 learning loops with exploration set to 50%
Personalizer adjusted with the new user preference quicker when exploration was utilized.
|
| User selection of Project-D
|
Personalizer Service started reflecting the change in user preference (from Project-C to Project-D) by ranking Project-D at the top intermittently after 10 – 20 learning loops and ranked it almost consistently at the top after 120 learning loops with exploration set to 50%
|
Test Run 2
In this 2nd test run, the impact of having and removing sparse features (little effective features) is observed.
Unit Test Scenario |
Learning Loops, Results and Exploration Setting |
| User selection of Project-E | Personalizer Service started reflecting the change in user preference (from Project-D to Project-E) by ranking Project-E at the top intermittently after 10 – 20 learning loops and ranked it almost consistently at the top after 150 learning loops with exploration set to 20% |
| User selection of Project-F | Personalizer Service started reflecting the change in user preference (from Project-E to Project-F) by ranking Project-F at the top intermittently after 10 – 20 learning loops and ranked it almost consistently at the top after 250 learning loops with exploration set to 20% |
| User selection of Project-G | Two less effective features (sparse features) of type datetime were removed. Personalizer Service started reflecting the change in user preference (from Project-F to Project-G) by ranking Project-G at the top intermittently after 5 – 10 learning loops and ranked it almost consistently at the top after only 20 learning loops with exploration set to 20%
|
| User selection of Project-H
|
Two datetime sparse features were added back. Personalizer Service started reflecting the change in user preference (from Project-G to Project-H) by ranking Project-H at the top intermittently after 10 – 20 learning loops and ranked it almost consistently at the top after 500 learning loops with exploration set to 20%
|
Thanks for reading! In the next part of this blog post, we will look at the best practices and recommendations for implementing Personalizer solutions. We will also touch upon the capacities and limits of the Personalizer service at present.