


 Because of our broad knowledge in building web applications, AIS decided to develop a prototype that highlights the features and capabilities of open standards for geospatial processing and data sharing through web applications.
We chose the Visible Infrared Imaging Radiometer Suite (VIIRS) as our data source for the demonstration. VIIRS collects visible and infrared imagery and radiometric data for civil and military Earth monitoring. (The Day/Night Band (DNB) datasets available from NOAA’s Comprehensive Large Array-Data Stewardship System are not quite in the format we need for our application, since they are sensor data records stored within an HDF5 container.)
The first step was to convert the data into a commonly supported raster imagery format that our server could recognize. To assist with this transformation, we use a very well-known open source library called the Geospatial Data Abstraction Library (GDAL). GDAL is written in C and C++ and provides utility programs for retrieving statistical information, translating, warping and many, many other things. Using the gdalwarp utility, along with a VRT file and the Python bindings, we were able to script a solution to extract the calibrated sensor data and geolocation information to generate a GeoTiff file.
We then used gdal_translate to scale and tile the GeoTiff and gdaladdo to build over view images. gdal_polygonize is the last utility method we used to create vector polygons from the connected regions of pixels within the GeoTiff with the output stored into a ESRI shapefile. So now we have our VIIRS data in both GeoTiff and shapefile format, both of which are commonly used in GIS applications.
Our software solution contains multiple elements. The fundamental piece of the application is to produce and consume data through Open Geospatial Consortium (OGC) Web Feature Service (WFS) and Web Map Service (WMS) web services. WMS and WFS are HTTP interfaces for requesting geospatial information in a standard way. With WMS the response consists of one or more georeferenced images as JPEGs or PNGs that can then be displayed by the application. WFS, on the other hand, is used to request geographic features which can be further analyzed. WFS responses are typically encoded in Shapefile, GML or JSON formats.
To serve out our data we elected to use GeoServer, an open source software server solution that is the reference implementation of the OGC standards. It’s fairly straightforward to set up GeoServer on a Linux server — just follow the online documentation. We had to slightly modify our approach since we were deploying to Amazon Web Services (AWS). At this point we were able to upload our VIIRS GeoTiffs and shapefiles to our GeoServer, and then style our data and serve it out via WMS and WFS web services.
For our web application, we elected to use ASP.NET MVC deployed to a Windows server on AWS. We chose ASP.NET MVC since we’re very familiar with this patterns-based framework and also to explore the Web API and the SignalR features. The Web API allows us to easily create HTTP services and (in our case) a service to notify our application server that new layers are available in our GeoServer. SignalR comes into play for adding real-time notification to connected clients that new layers are available.
On the front end, OpenLayers, JQuery and KnockoutJS were used for loading and displaying maps, cross browser DOM manipulation, and to support dynamic user interfaces through MVVM to more clearly separate the UI from the business logic and behavior.
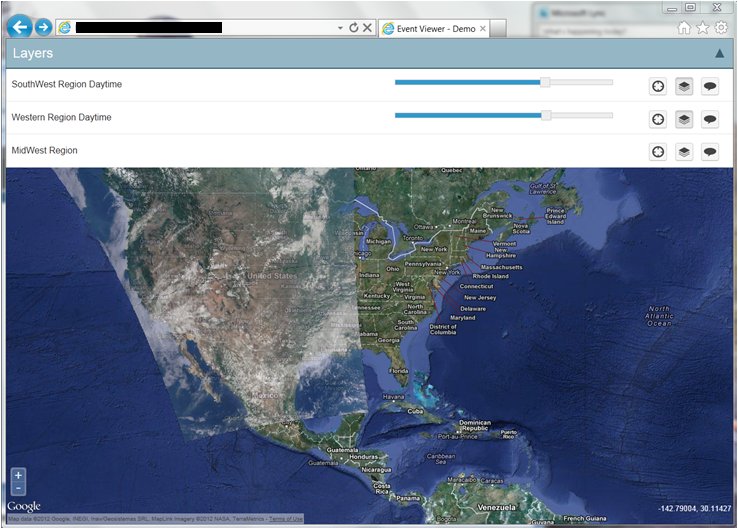
Figure 1 shows our web application with a base map composed of Google image tiles (a simple layers menu for selecting layer visibility) setting transparency and chatting about a specific layer. The layer menu across the top may not be optimal, but we chose this layout to demonstrate our application’s responsiveness to multiple devices such as tablets and mobile phones.
You’ll also notice two daytime collections over the western hemisphere of the United States. These are VIIRS visible collections converted into GeoTiff format and retrieved via WMS web services by clicking on the layer button. In the figures to follow we demonstrate the WFS and WMS services with the VIIRS DNB datasets.
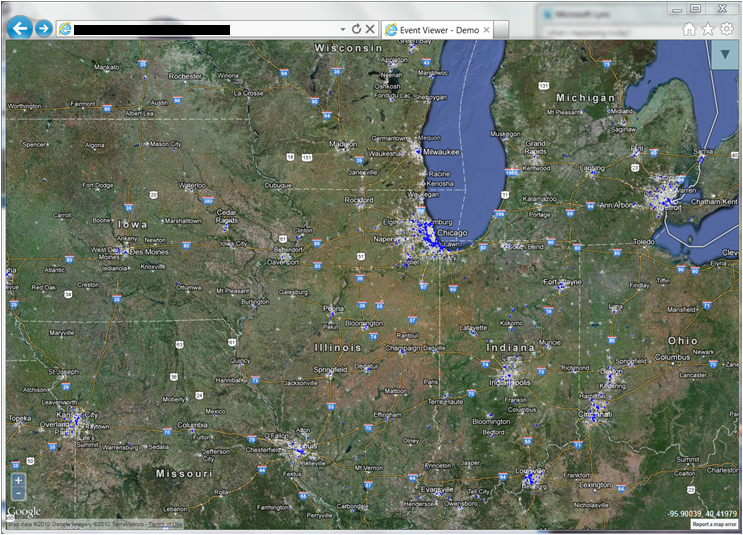
Figure 2 displays VIIRS Day/Night Band in both WMS and WFS form. The DNB data is useful for detecting city lights (as indicated by the the white areas on the map). The blue polygons are the results of the WFS service call returning a shapefile. You may notice the shapefile doesn’t overlay well with the night lights image — that is because we didn’t specify a mask when using gdal_polygonize to create the feature layer. The default behavior for gdal_polygonize creates polygons around adjacent pixels with the same value.
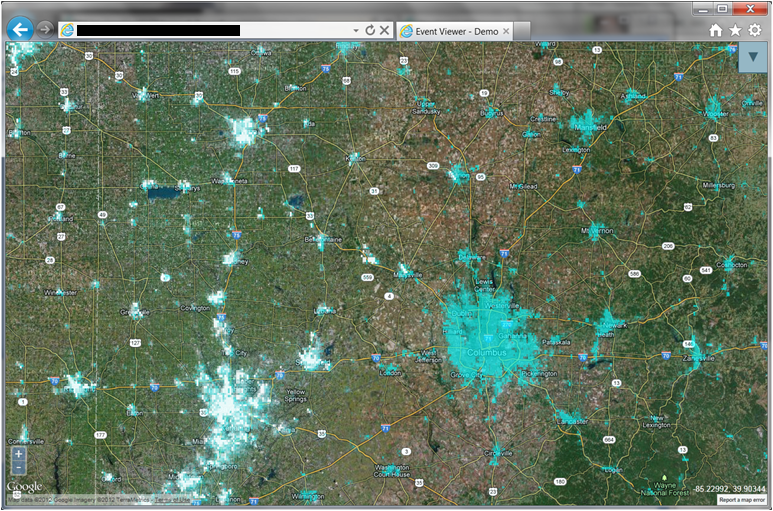
Figure 3 displays multiple VIIRS Day/Night Band datasets for comparison. In our example, you can quickly determine there are lights across the entire display in one collection and only about half in the other. Being able to perform comparisons like this can be very useful in assessing the impact of a major power outage.
For several years, AIS has focused on developing primarily browser-based solutions. We were very excited to leverage our knowledge and apply it to a geospatial domain.
Technologies Employed:
- OpenLayers
- GeoServer
- OGC WFS/WMS
- GDAL
- KnockoutJS
- JQuery
- Amazon Web Services
- ASP.NET MVC
- SignalR
- Web API
- Python