


Once you’ve decided to instrument your ASP.NET Core application with Application Insights, you may be looking for a quick way to troubleshoot telemetry configuration. For details on why you should be using Application Insights and how to get started, please reference my previous post in this blog series. How do you go about testing your telemetry configuration? Typically, developers would adjust the application and would then deploy to Azure, ideally your development environment in Azure. However, making a change to an application, building, publishing to Azure and testing the given endpoints. Waiting for telemetry to appear in Application Insights can require upwards of 30 minutes per change assuming that you know what you are doing and without making any mistakes. Is there a way to work locally?
Troubleshooting Locally
Let me start by discussing the end goal. We want to simulate our production environment while running locally on our dev machine. Azure typically provides local emulators for services like storage and Cosmos. They do not provide an Application Insights emulator. When running locally we want to simulate production, but we will need to send data to an actual Azure Application Insights account. In order to simulate running in production, we should publish our Dotnet application in Release mode and begin outside of Visual Studio. The reason for starting the application outside Visual Studio is that our production environment will not have Visual Studio installed. Another reason for starting the application outside Visual Studio is because Visual Studio includes a Diagnostic panel that captures the Application Insights telemetry and prevents it from being sent to the Azure Application Insights account. I’d like to emphasize that the Diagnostics panel built into Visual Studio is not an emulator and shouldn’t be used for that purpose.
First, we must publish the application in Release mode. You can do that using the dotnet command-line as shown below.
![]()
This will publish to a directory similar to the below,

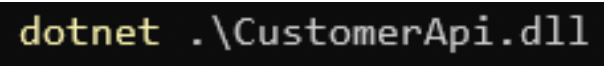
Once in the directory where the build artifacts are, we should find both appsettings.json and the .dll for our main application, CustomerApi.dll in my case. From the command-line. We can then run Kestrel directly, using the following command-line.
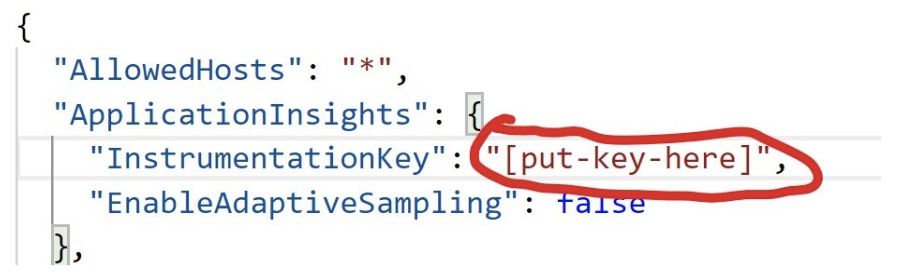
If using the defaults, your application will now be running and available in a browser at either http://localhost:5000/ or https://localhost:5001/. We are likely still missing one step, which is configuring the telemetry key for Application Insights. In the bin\Release\netcoreapp3.0\ folder, locate the appsettings.json. Open the file and put the telemetry key in the file.
If you go back to the command-line you can press Ctrl+C to exit the running web application and then re-run the dotnet CustomerApi.dll command to restart the application. We now have an application running locally that is sending telemetry to Application Insights in Azure.
View Live Telemetry from Local Machine
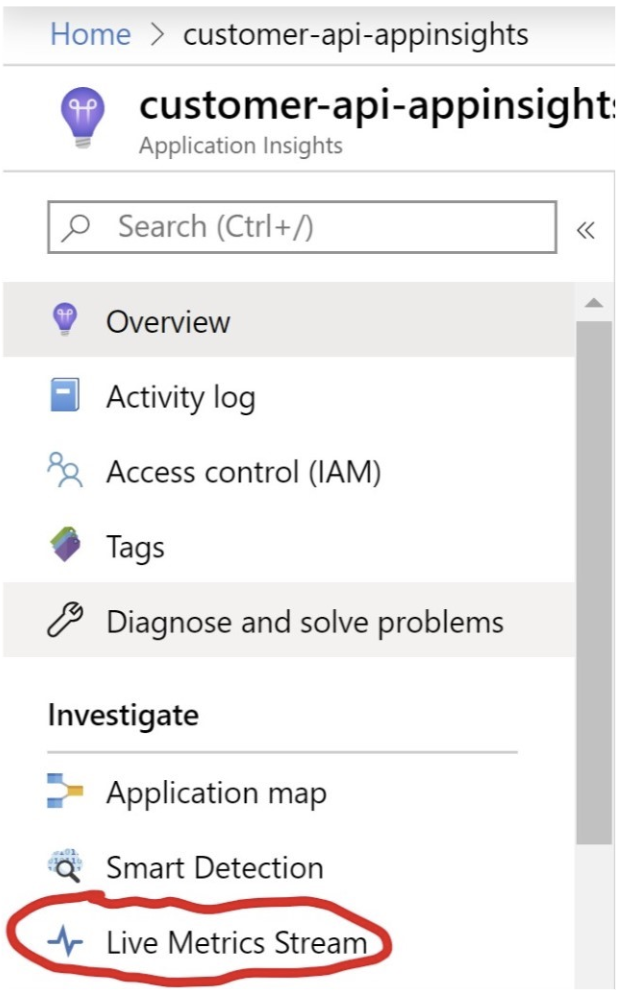
In the Azure portal, open the Application Insights resource and then locate the “Live Metrics Stream” blade.
The Live Metrics panel should open and connect as long as the application is running locally using “dotnet CustomerApi.dll”. Once open, scroll to the bottom of the pane.
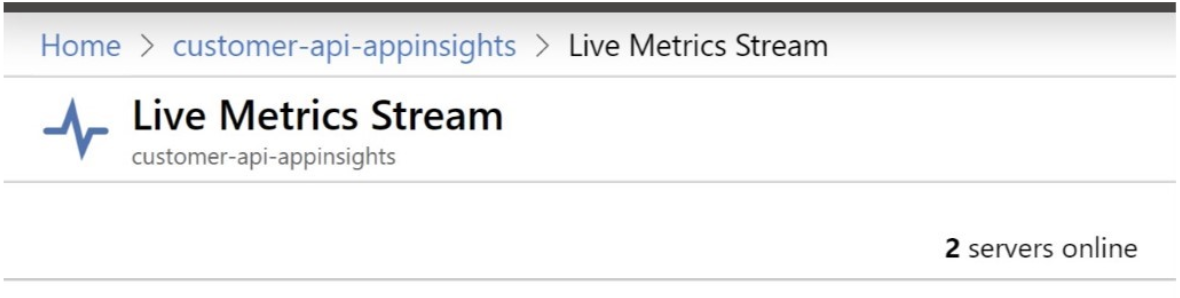
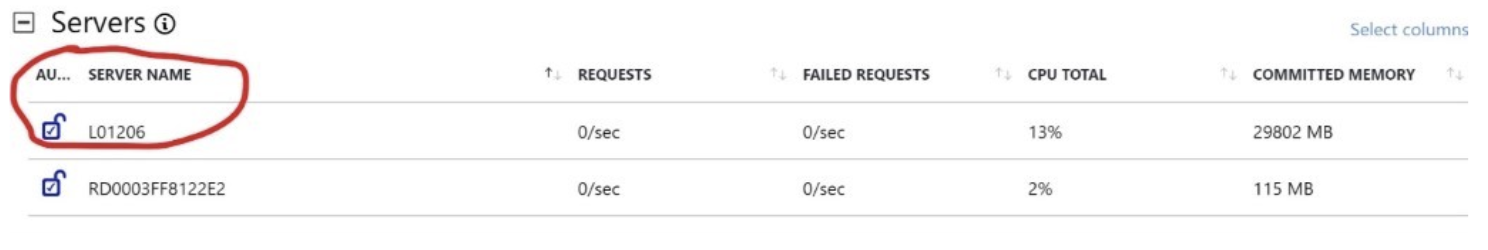
At the bottom, you will see a list of connected servers. In my example below, you see two servers. The one highlighted in red is my local developer machine. The other server is the Azure Application Service that I have running in my development environment in Azure.
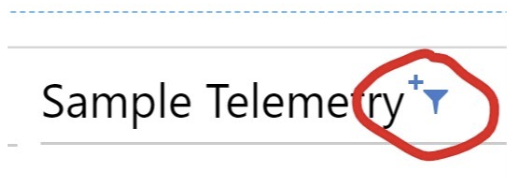
To quickly recap we have our application running locally outside Visual Studio on a command-line and in Azure Application Insights, we can see our local machine is connected up to live metrics. In order to actually see telemetry flow into this panel, you will likely want to make one other change. In the upper-right, click on the filter icon to adjust the live metrics filters.
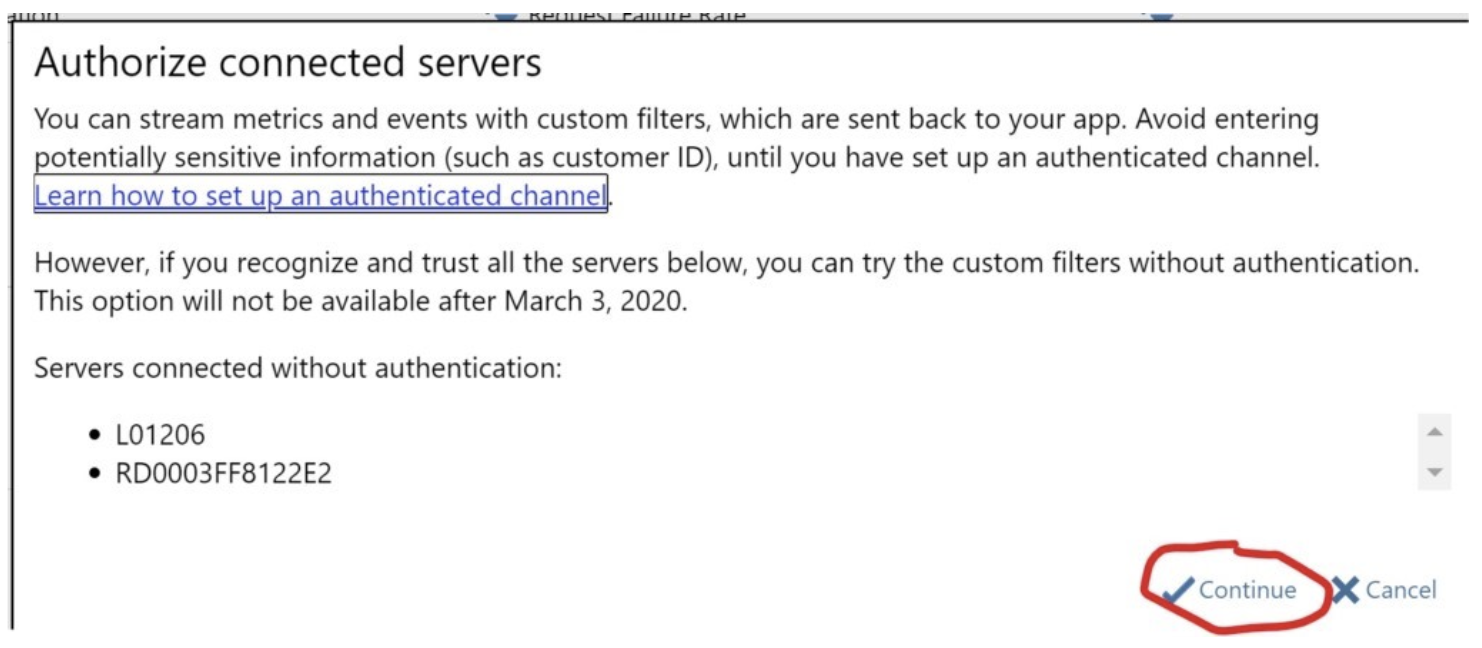
You will then be prompted with the following dialog. If you trust the servers you can safely ignore.
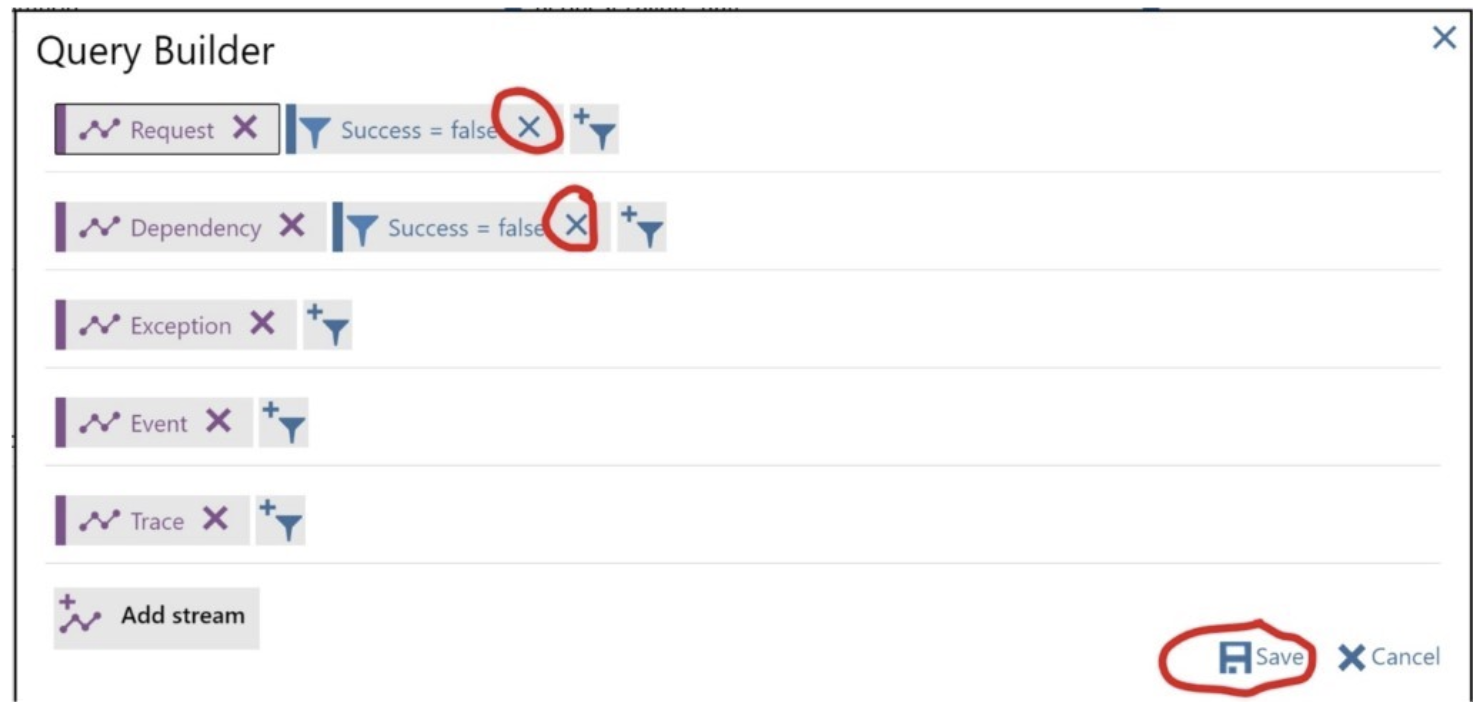
You will then see a dialog with the current filters. Notice that the default configuration will only show failed requests and dependency calls. Since we are troubleshooting it’s likely you will want to see all requests. Feel free to click the “x” to remove both filters and then the “Save” button.
Once you have completed this step, you can go back to your web browser on your local machine, either http://localhost:5000/ or https://localhost:5001/ and then make a request to your API. I tried a URL I know returns a 404 response. You can see the live telemetry that showed up for me:
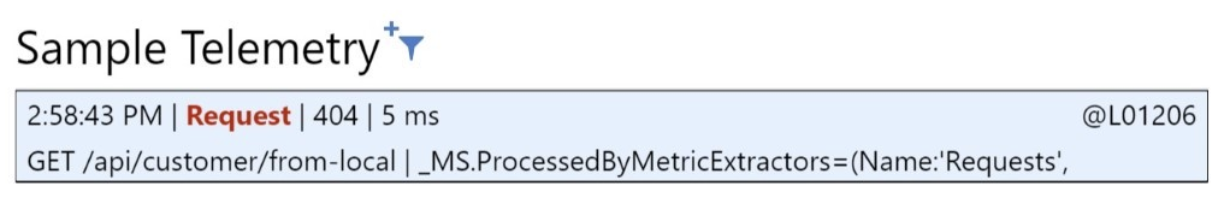
Then, click on that row for more details about the given telemetry item. This telemetry is also being logged to Application Insights and you will be able to see it on all the usual dashboards and search for it using Log Analytics query, just be aware there is still the typical 2 to 5-minute delay between when it is sent and when it will appear in queries and dashboards.
Summary
You have now learned how to troubleshoot Azure Application Insights quickly and without needing to deploy your application to Azure. To summarize, you run “dotnet publish” in “Release” mode locally and then run the application from the command-line outside Visual Studio. This is done for a few reasons:
- When publishing in release mode, you do not need to worry about appsettings.development.json
- By running outside Visual Studio, you do not need to worry about launchSettings.json setting any special environment variables that don’t match your production environment (e.g. ASPNETCORE_ENVIRONMENT)
- When running outside Visual Studio, you do not need to worry about the diagnostics panel deciding to capture your telemetry and preventing it from being sent to Azure.
Once your application is running locally and has the Application Insights telemetry key configured properly, you will find the telemetry in the “Live Metrics” view so you can avoid the typical 2 to 5-minute delay between sending telemetry and will see it elsewhere in Application Insights.
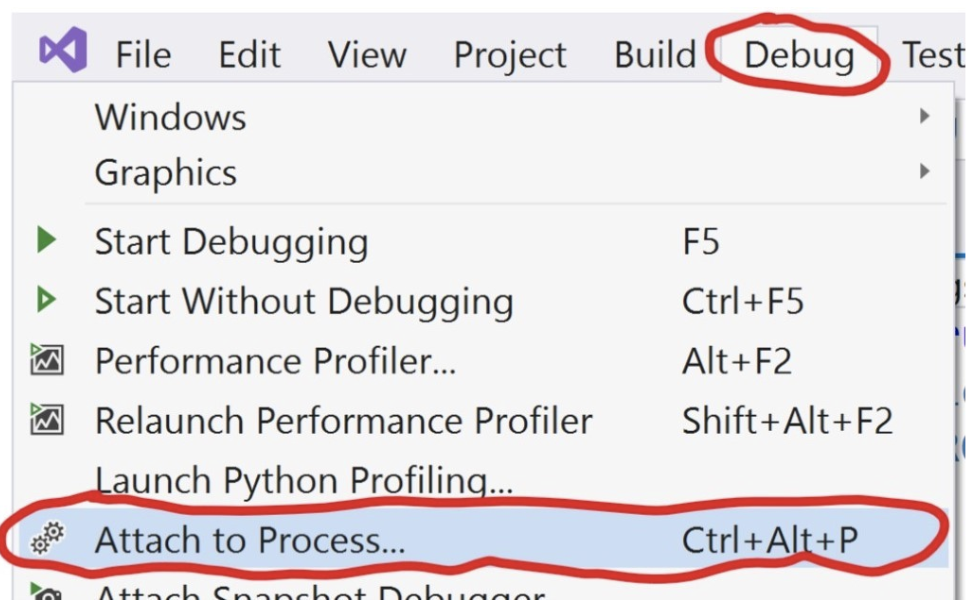
If you are concerned that this setup will not allow for the use of the Visual Studio Editor, think again! Once you have the application running outside Visual Studio, simply use the “Attach To Process…” menu item in Visual Studio. This gives you the best of both worlds:
Hopefully, this post helped you understand how to more quickly how to troubleshoot your Application Insights telemetry configuration. That will come in handy in the next post for this series, where we talk about customizing telemetry to keep PII (Personally Identifiable Information) out of your application insights logs.