


 Are you writing a lot of JavaScript as part of your web application? Spending a lot of time debugging that JavaScript? I want to discuss a debugging technique today using that old standby, console.log and overcoming one of its deficiencies.
Using console.log can be useful for printing out application state without interrupting your workflow. Contrast that with using a JavaScript breakpoint where you are forced to break your workflow to check the application state and then resume the execution of your application.
So, now that I’ve refreshed your memory on the upside of console.log over a breakpoint, let’s talk about the downside compared to breakpoints. To add a console.log statement, you have to edit the source code of your application. And editing the source code of your application is an even bigger break in your debugging workflow. You have to go back to the editor, add the log statement, refresh the page, and then go back to where you were. And don’t forget to remove that log statement before you commit your source code.
Well what if you could avoid those limitations?
- What if you could dynamically add/remove console.log statements to an application running in a web browser?
- What if when you added those console.log statements you didn’t have to worry about committing them to source control?
- What if you could add console.log statements to any code in a web application, even code like JQuery or Angular or some other third-party code?
- What if you could dynamically add/remove console.log statements in browsers all the way to IE8?
You can. Just follow these three simple steps:
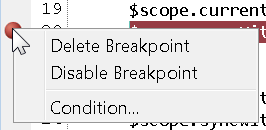
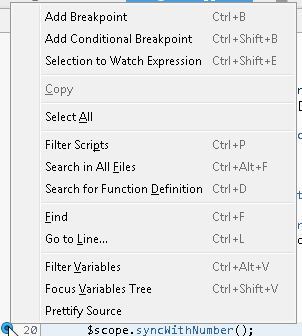
- Add a breakpoint where you’d like your console.log statement to be
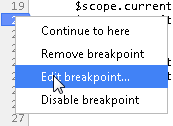
- Right-click on the breakpoint to set the condition of the breakpoint
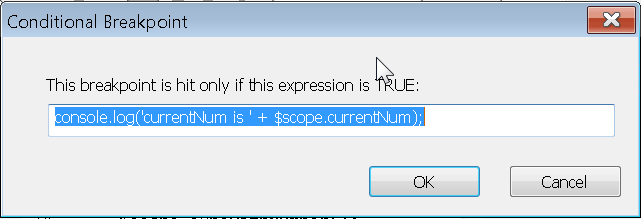
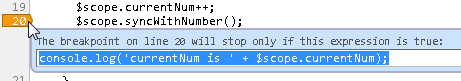
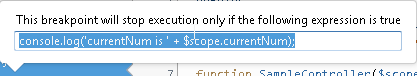
- In the dialog that comes up set the expression as console.log(‘message’). If you want detail about a variable just include that in your expression, something like console.log(‘name is ‘ + name + ‘ age is ‘ + age). Or you could do something like console.log(‘complicated obj is ‘ + JSON.stringify(obj));
That’s all you need to do.
I have some screenshots showing the right-click menu and the dialog that comes up for a variety of browsers. If you scroll down further, I’ll quickly explain why it works.
IE8
Chrome
Firefox
So, how does it work?
Well, we are using conditional breakpoints, which is a feature found in quite a few debuggers, such as Visual Studio, Eclipse and Python. When the conditional expression is true, the debugger stops at the breakpoint. When the conditional expression is false, the debugger still executes the expression but will not stop at the breakpoint.
The big difference here that you are using the JavaScript debugger. With the JavaScript debugger, the meaning of conditional expression isn’t so hard and fast as it would be in other languages and debugger. This is because of the JavaScript concept of truthy and falsey. So, you can really put any JavaScript statement in as the condition and it will be evaluated as truthy or falsey. In our case console.log returns undefined which evaluates falsey. So, every time the debugger evaluates our condition by executing console.log and we see the message in the console. Since console.log is falsey, it continues on instead of stopping the debugger. If you didn’t want log statements, you could replace them with alert(‘message’). Try it, it works. You could probably do even crazier things with breakpoint conditions, but I’ve only gone so far as console.log and alert.