


In this post let’s see how Microsoft Teams’ capability to embed tools and applications on Teams channels can be leveraged to enhance collaboration and visibility within a team.
We will create a Power App to record Objectives and Key Results (OKR) of employees and teams. We then create a Power BI report to better visualize the data and metrics. The Power App and the Report will be added as tabs to the Teams channel so that users can collaborate with their team members, keep updating the OKR, and view the progress charts.
Let’s Get Started!
Data Model
One of the critical aspects of the app is to identify the attributes that are needed to capture relevant data. As the name suggests, Objectives and Key results are the primary attributes that will be needed. Along with that, we will also have to create Owner (users), the Team (to which the owners belong), and the Progress Bar to track the completion of the “Key Results” on the “Objective”. For this app, we will use a SharePoint List as a data source and implement the above data model.
Power Apps
- The canvas app is created in a tablet mode and the SharePoint list is added as a data source. Relevant styling and functionality are built in the app.
- This is a screen on which the data from SharePoint is displayed in the context of the current logged in user. Users can perform CRUD operations on the data from this screen.
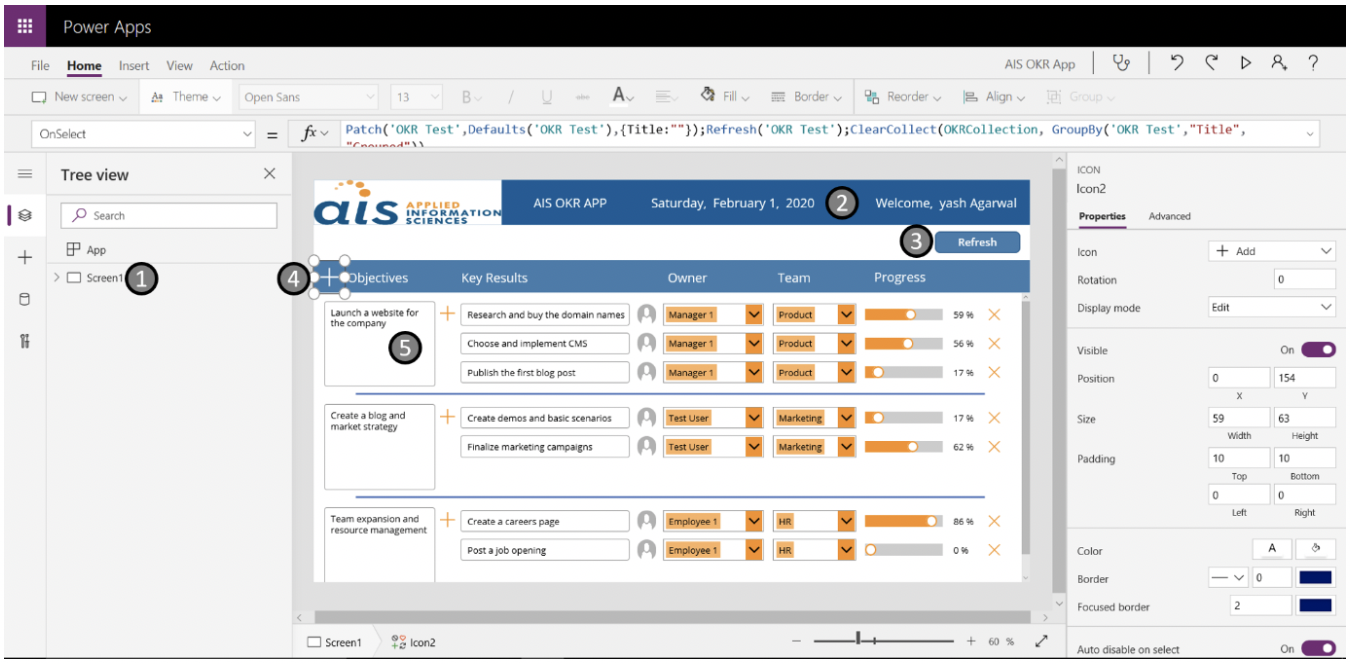
- This tab displays basic information such as the current date and the currently logged-in user.
- This is a refresh button that refreshes the data source and brings the latest data to the app.
- This icon creates a new item in SharePoint with a parent title to store the Objectives.
- This is a gallery control that displays data from the SharePoint list. Each objective can have multiple key results that can be created by hitting the ‘+’ icon in the gallery.
Power BI
The data stored on the SharePoint list is analyzed via charts on a Power BI report. Charts are created to visualize metrics as below:
- Percentage objective completion
- Objective completion by team
- Objective completion by individual users
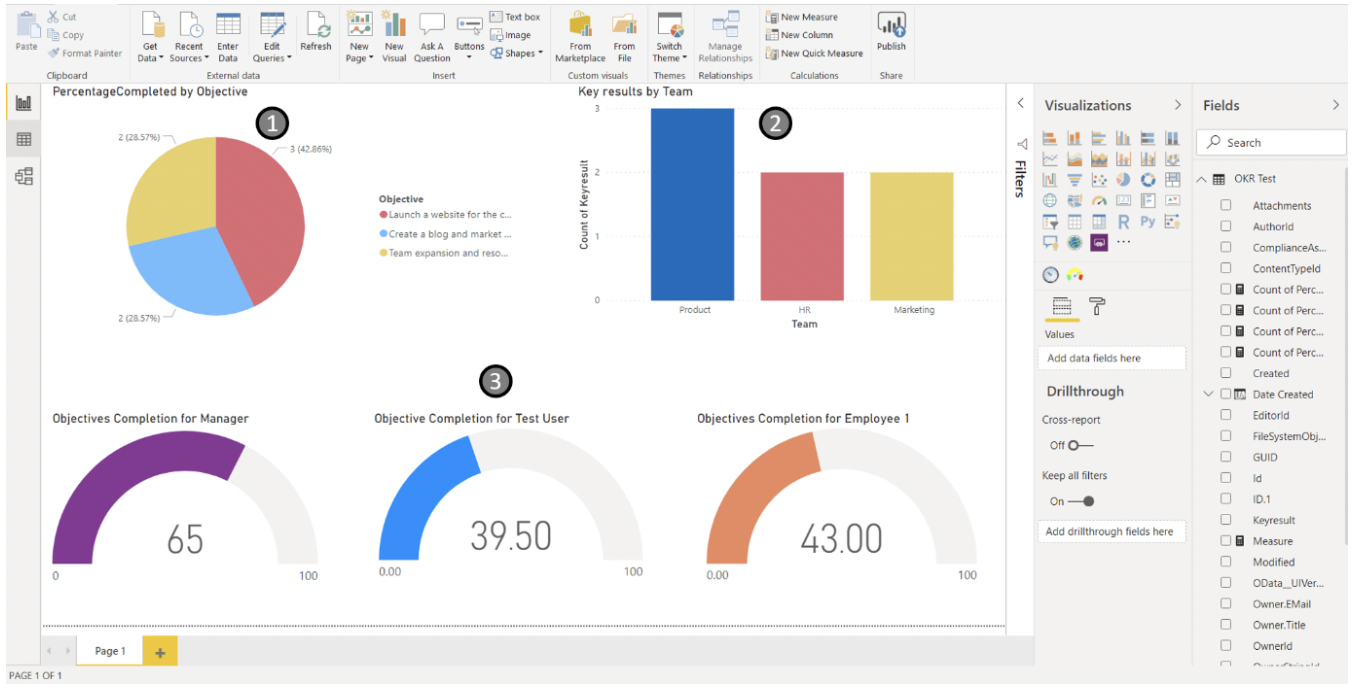
Relevant metrics can be similarly visualized using charts in Power BI and the data set can be set to refresh on a schedule.
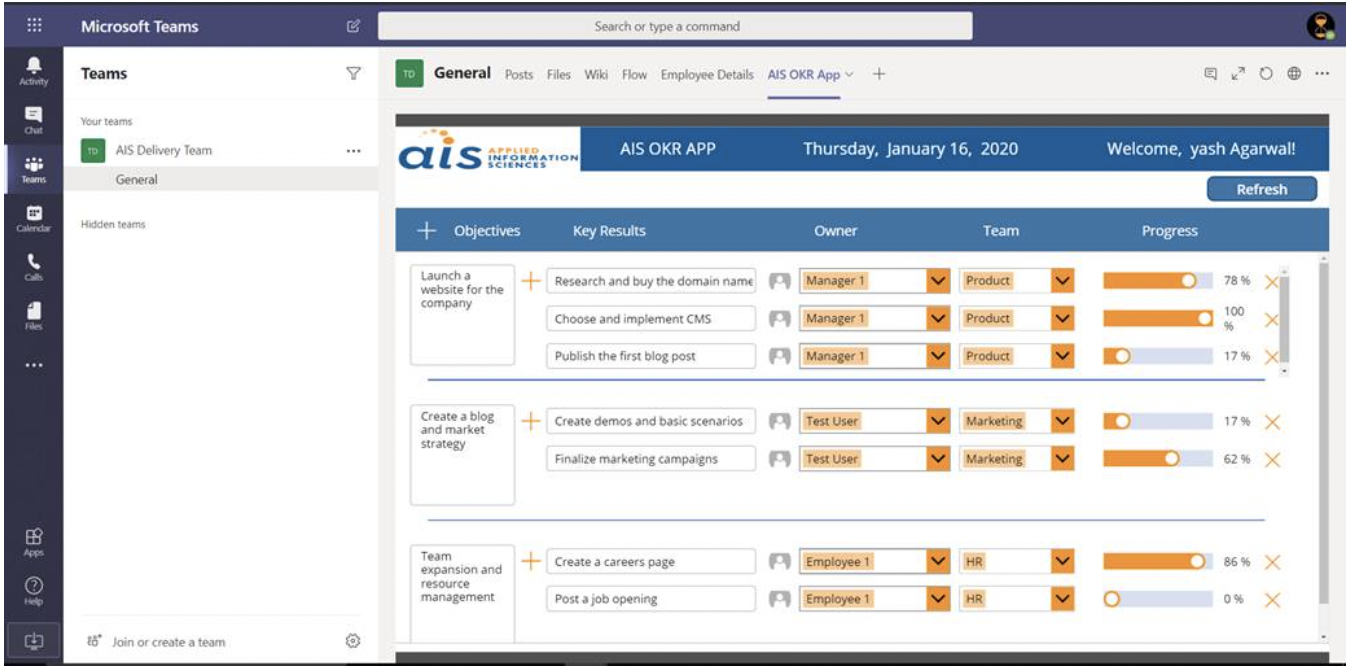
MS Teams (Setup in Action)
Team members can collaborate on a single channel and do not have to switch between devices, platforms, screens, applications, etc. The canvas app is added to the Teams channel as a tab as shown in the image below.
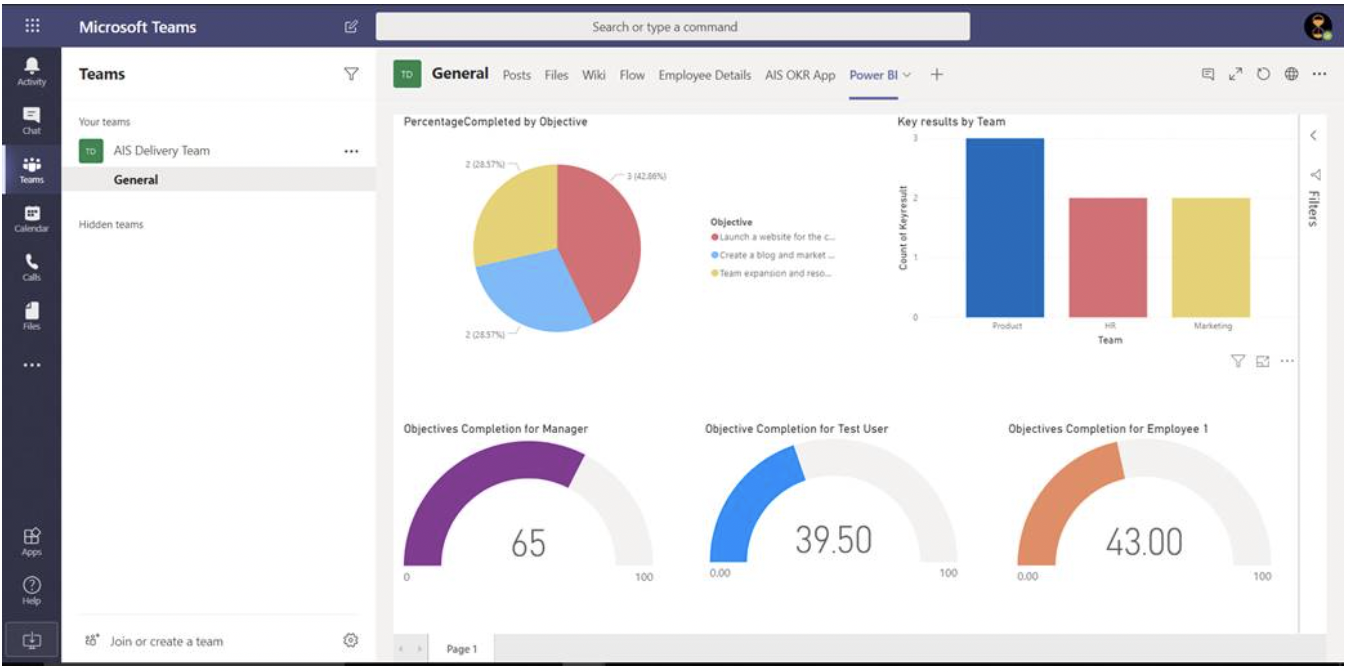
The Power BI report is added to the channel as a tab as shown in the image below.
In this post we saw how day-to-day processed within groups in an organization can be digitally transformed to apps using Power Apps, metrics analyzed on Power BI visuals can be implemented on MS Teams channels to enhance collaboration and teamwork.
Teammates can view their respective objectives, responsibilities, and track their productivity in a single place without having to launch or switch between different applications or reports.
Processes like these bring transparency in evaluating productivity with respect to the tasks, teamwork, and individual standpoints. Microsoft Teams is a great way to enable your teams to better collaborate, and plugging in Power Apps, Power BI, and other tooling can snowball the impact it has on your organization’s digital transformation efforts.
I hope you found this interesting and it helped you. If you’re looking to empower your team with a similar solution, check out our Accelerated Teams Enablement or Teams Governance Quick Start offerings, as well as our Power Platform Quick Start! Thank you for reading!