


AIS developed a prototype web application that leverages open standards for real-time data sharing and geospatial processing. It’s highly suggested you read our first two blog posts on this application, part one and part two.
In this post, we are going to discuss three areas of improvement for the application. We wanted to improve collaboration, improve management of events by adding a search capability, and improve the edit capabilities.
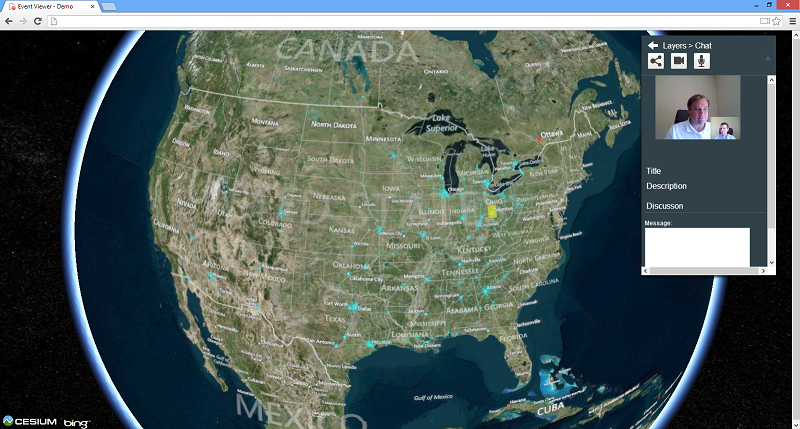
At this point, the application enables collaboration via text-based chat and session sharing. But text-based chat can be limiting, so providing video and audio chat (such as Skype) can be much more effective. The W3C published the Web Real-Time Communications (WebRTC) specification that allows audio and video chat in the browser without needing any plug-ins. And the latest releases of both Firefox and Chrome have added support for WebRTC. So we leveraged the SimpleWebRTC javascript library and were able to quickly and easily integrate audio/video chat into the web application. You can see a screenshot below:
We also wanted to improve event management, because the existing application showed the user all events, even if they weren’t within the part of the world being viewed. This could confuse users, showing them events over the United States even if you were only viewing Australia. Showing all events to users all the time could also overwhelm them as more events were added to the system. To improve the situation we looked for a system where we could store metadata about the events, including their geographic location, and perform arbitrary searches quickly. This led us to MongoDB, which is a NoSQL system that supports geographic searches. We stood up an instance of MongoDB to store metadata about every event, including its extents in latitude and longitude. We then wired up events for OpenLayers, the 2-D map, and Cesium, the 3-D map, to call back to the server whenever the map location changed to get the matching events. This reduced user confusion by only showing them events relevant to their viewing location.
But as more events are added to the system, the time of the event becomes nearly as important as the location in terms of helping users find relevant events. So we updated our MongoDB records to include time information with each event. We then built a custom time slider using JQuery UI Slider, JQuery UI Labeled Slider, JQuery UI Drag Slider and Moment JS. As the user adjusts the start and end time on this slider we make a query back to the server and MongoDB that returns the relevant events. We also visually show the events and their associated time as tick marks on the slider. The event listing is updated in real-time as the user moves the slider so that they get quick and immediate feedback about the events that match both their time selection and their current viewing location on the map. You can watch the video to see the improved search capability.
Our last area of improvement was editing capabilities. The existing application only had the ability for users to draw out annotations. The user might have an existing shapefile on their system that they wanted to add to the existing data in the system. Could we support this feature in a web application? We had to write server-side code that parsed the shapefile metadata and then pushed the metadata into our MongoDB instance. Once that was solved, we needed to load the data into our existing GeoServer. The same server-side code was updated to do that using the GeoServer REST API. And with that, we had a working solution where a user uploads a shapefile and the map is updated for all users with the newly uploaded data.
And so we were able to push our application even farther by leveraging some of the latest standards and technologies while still remaining a browser-based solution that works on a variety of devices.